> ## Documentation Index
> Fetch the complete documentation index at: https://docs.gcore.com/llms.txt
> Use this file to discover all available pages before exploring further.
# Configure GPU autoscaling for Kubernetes
GPU autoscaling in a Kubernetes cluster combines four components: NVIDIA GPU Operator for resource management, KEDA for event-driven pod scaling, Prometheus for metrics collection, and Gcore Cluster Autoscaler for node provisioning. When GPU utilization exceeds the configured threshold, KEDA creates additional pods — Cluster Autoscaler then provisions new GPU Bare Metal nodes to meet the demand.
Gcore Managed Kubernetes includes native autoscaling based on CPU and memory only. To scale workloads based on GPU utilization, [KEDA](https://keda.sh/) must be manually installed and configured.
## Prepare the cluster
Create a Kubernetes cluster with a GPU Bare Metal worker pool and verify that nodes are ready before installing GPU software.
### Step 1. Create a Kubernetes cluster
Add a new Managed Kubernetes cluster with a Bare Metal worker pool:
1. In the [Gcore Customer Portal](https://portal.gcore.com), navigate to **Cloud** > **Kubernetes**.
2. Click **Create Cluster**.
3. Select a region — the location of the data center where the cluster will be deployed.
4. Select the Kubernetes cluster version: v1.28.6 or higher.
5. Configure Bare Metal pools:
* **Pool name**: Enter a unique and descriptive name for the resource pool.
* **Minimum nodes** and **Maximum nodes**: Specify how many nodes can be allocated to the pool during traffic fluctuations. The maximum number of nodes must be greater than the minimum to allow the cluster to scale up in response to increased demand.
* **Type**: Select **GPU Bare metal instances**.
* **Infrastructure**: Select the needed GPU-optimized flavor. At least one node with GPU support must be added to the worker pool.
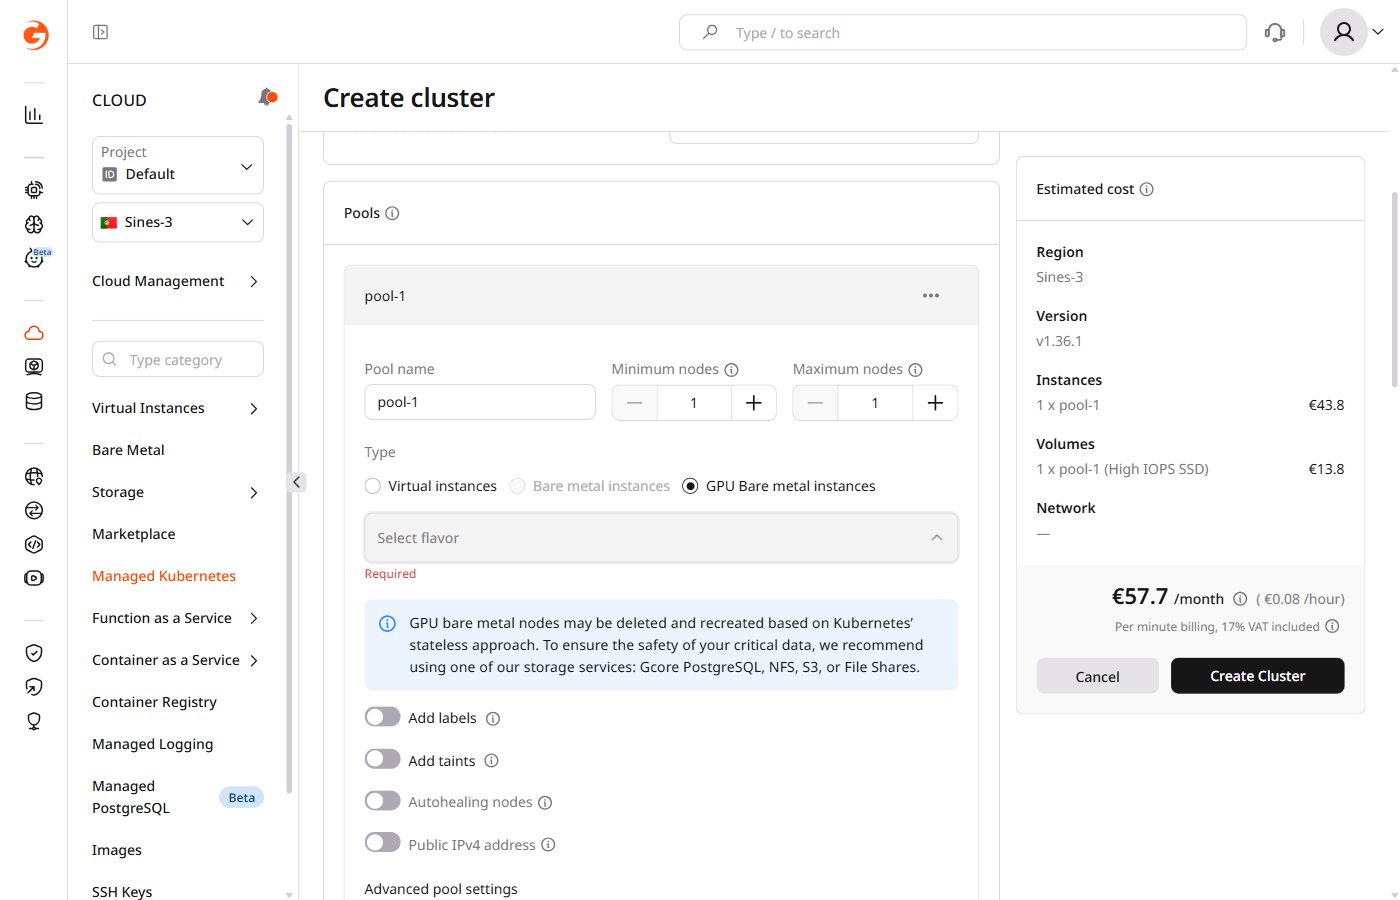 6. (Optional) Add labels to include additional node metadata. Add taints to define which Kubernetes pods can be scheduled on these nodes.
7. Disable the **Autohealing nodes** toggle.
8. (Optional) Enable the **Public IPv4 address** option to assign public IPv4 addresses to cluster nodes.
9. To add more pools, click **Add pool** and configure each according to the previous steps.
6. (Optional) Add labels to include additional node metadata. Add taints to define which Kubernetes pods can be scheduled on these nodes.
7. Disable the **Autohealing nodes** toggle.
8. (Optional) Enable the **Public IPv4 address** option to assign public IPv4 addresses to cluster nodes.
9. To add more pools, click **Add pool** and configure each according to the previous steps.
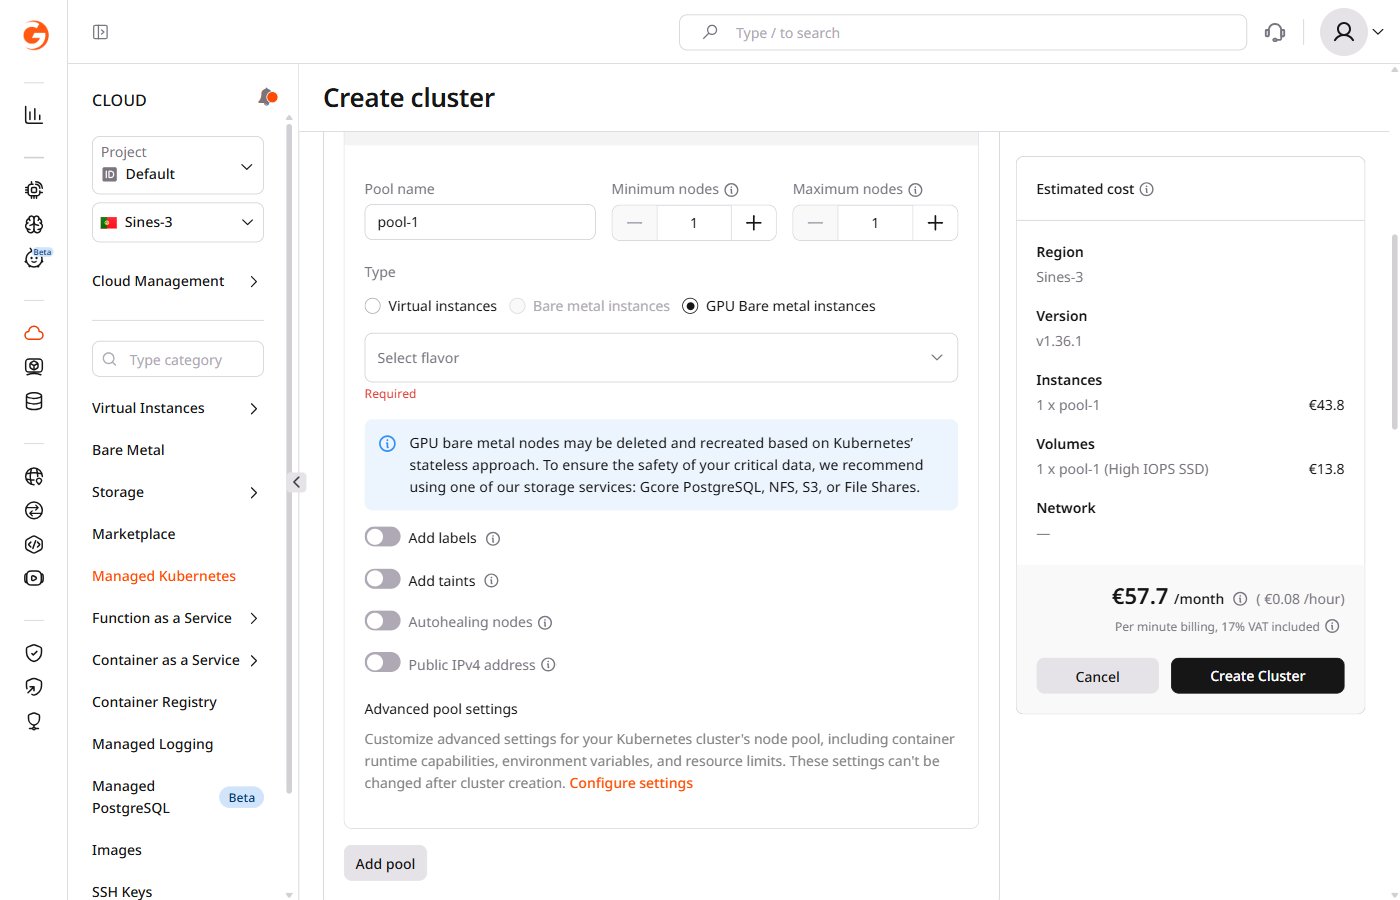 10. Complete the remaining cluster settings starting from [step 5](/cloud/kubernetes/clusters/create-a-kubernetes-cluster#step-5-select-the-cni-provider) in the [cluster creation guide](/cloud/kubernetes/clusters/create-a-kubernetes-cluster).
### Step 2. Verify the Kubernetes configuration
1. In the Customer Portal, navigate to **Cloud** > **Kubernetes**.
2. Find the cluster created in the previous step and click its name to open it.
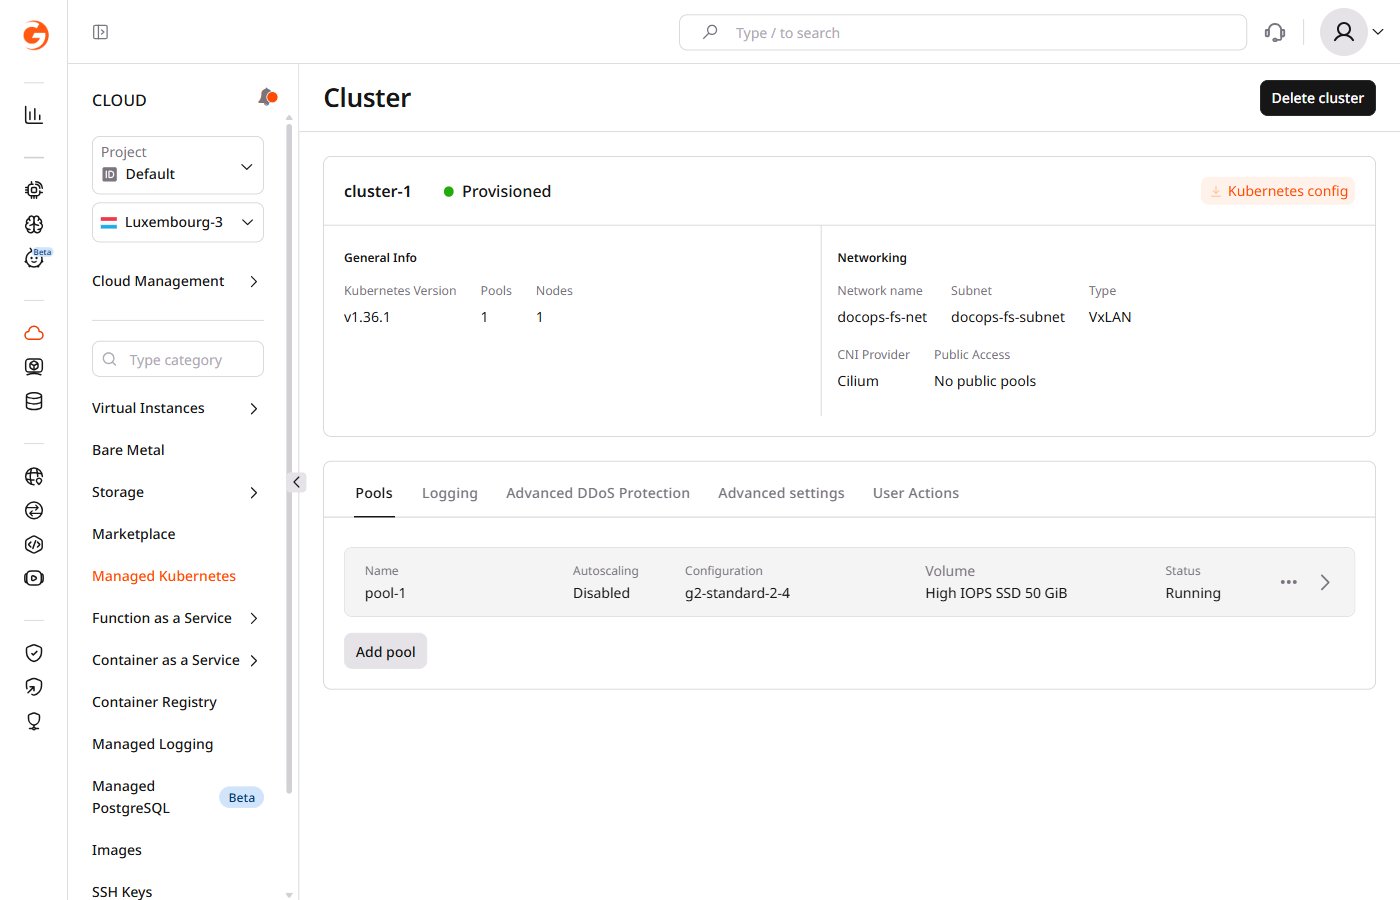
3. Check the pool status: it should be **Running**. If the status shows **Scaling up**, wait until all resources are allocated and the cluster is ready to use.
4. Download the .config file by clicking **Kubernetes config** in the top-right corner of the screen.
10. Complete the remaining cluster settings starting from [step 5](/cloud/kubernetes/clusters/create-a-kubernetes-cluster#step-5-select-the-cni-provider) in the [cluster creation guide](/cloud/kubernetes/clusters/create-a-kubernetes-cluster).
### Step 2. Verify the Kubernetes configuration
1. In the Customer Portal, navigate to **Cloud** > **Kubernetes**.
2. Find the cluster created in the previous step and click its name to open it.
3. Check the pool status: it should be **Running**. If the status shows **Scaling up**, wait until all resources are allocated and the cluster is ready to use.
4. Download the .config file by clicking **Kubernetes config** in the top-right corner of the screen.
 5. Export Kubernetes configuration locally:
```sh theme={null}
export KUBECONFIG=/path/to/your/k8sConfig.yml
```
6. Verify that the node is ready:
```sh theme={null}
kubectl get nodes
```
The expected output looks similar to this:
```sh theme={null}
NAME STATUS ROLES AGE VERSION
ed-b16-82-160-248 Ready 3h26m v1.28.6
```
## Install dependencies
Install the GPU Operator to expose GPU resources, then KEDA and Prometheus to drive utilization-based scaling decisions.
### Step 3. Install GPU Operator
Use Helm to install the GPU Operator — the [official Helm docs](https://helm.sh/docs/intro/install/) cover installation for all platforms.
1. Add the NVIDIA Helm repository and update it:
```sh theme={null}
helm repo add nvidia https://helm.ngc.nvidia.com/nvidia && helm repo update
```
2. Install the GPU Operator. Use version `v23.9.1` for Kubernetes 1.28.x or `v23.9.2` for Kubernetes 1.29.x:
```sh theme={null}
helm install gpu-operator nvidia/gpu-operator --version v23.9.1 --wait \
-n gpu-operator --create-namespace \
--set driver.enabled=false \
--set operator.defaultRuntime=crio \
--set operator.logging.level=debug
```
Once installation completes, verify that GPUs are visible to Kubernetes before continuing.
### Step 4. Verify GPU allocation
1. Run `kubectl describe node ` and check the **Allocatable** section. The `nvidia.com/gpu` value must match the GPU count specified in the Bare Metal flavor.
```sh theme={null}
Allocatable:
cpu: 192
ephemeral-storage: 850152999143
hugepages-1Gi: 0
hugepages-2Mi: 0
memory: 2113338172Ki
nvidia.com/gpu: 8
pods: 110
```
2. Check that all GPU Operator pods have **READY** status:
```sh theme={null}
kubectl get pods -n gpu-operator
```
The expected output looks similar to this:
```sh theme={null}
NAME READY STATUS RESTARTS AGE
gpu-feature-discovery-f4knk 1/1 Running 0 3m9s
gpu-operator-f7ffcf7f8-sf8m7 1/1 Running 0 3m34s
gpu-operator-node-feature-discovery-gc-7cc7ccfff8-77g45 1/1 Running 0 3m34s
gpu-operator-node-feature-discovery-master-d8597d549-dnxz5 1/1 Running 0 3m34s
gpu-operator-node-feature-discovery-worker-rlf6p 1/1 Running 0 3m34s
nvidia-container-toolkit-daemonset-rl9p2 1/1 Running 0 3m1s
nvidia-cuda-validator-78g72 0/1 Completed 0 2m32s
nvidia-dcgm-exporter-nv9bk 1/1 Running 0 3m9s
nvidia-device-plugin-daemonset-4l5fl 1/1 Running 0 3m9s
nvidia-mig-manager-rqnsq 1/1 Running 0 26s
nvidia-operator-validator-n9rpz 1/1 Running 0 3m9s
```
3. Run a test GPU application using the NVIDIA [CUDA vectorAdd](https://docs.nvidia.com/datacenter/cloud-native/gpu-operator/latest/getting-started.html#cuda-vectoradd) example. Deploy the example workload and confirm it completes successfully before continuing.
### Step 5. Install KEDA
With GPU resources confirmed, install KEDA — it reads Prometheus metrics to determine when to create additional pods.
1. Add the KEDA Helm repository:
```sh theme={null}
helm repo add kedacore https://kedacore.github.io/charts
```
2. Update the repository:
```sh theme={null}
helm repo update
```
3. Install KEDA into its own namespace:
```sh theme={null}
helm install keda kedacore/keda --namespace keda --create-namespace
```
### Step 6. Install kube-prometheus-stack
KEDA relies on Prometheus metrics to trigger GPU-based scaling decisions. Install the [kube-prometheus-stack](https://github.com/prometheus-community/helm-charts/tree/main/charts/kube-prometheus-stack) to collect and expose those metrics.
1. Add the Prometheus Helm repository, update it, and save the default values:
```sh theme={null}
helm repo add prometheus-community https://prometheus-community.github.io/helm-charts
helm repo update
helm inspect values prometheus-community/kube-prometheus-stack > values.yaml
```
2. Create the `values-overrides.yaml` file with the following content:
```yaml theme={null}
serviceMonitorSelectorNilUsesHelmValues: false
additionalScrapeConfigs:
- job_name: gpu-metrics
scrape_interval: 1s
metrics_path: /metrics
scheme: http
kubernetes_sd_configs:
- role: endpoints
namespaces:
names:
- gpu-operator
relabel_configs:
- source_labels: [__meta_kubernetes_endpoints_name]
action: drop
regex: .*-node-feature-discovery-master
- source_labels: [__meta_kubernetes_pod_node_name]
action: replace
target_label: kubernetes_node
```
3. Install kube-prometheus-stack:
```sh theme={null}
helm install prometheus-community/kube-prometheus-stack \
--create-namespace --namespace prometheus \
--generate-name \
-f values.yaml -f values-overrides.yaml
```
The `values-overrides.yaml` overrides the default Prometheus configuration to define a scrape job that collects DCGM metrics from the `gpu-operator` namespace.
## Configure autoscaling
With metrics collection in place, create the workload and the ScaledObject that tells KEDA how to scale it.
### Step 7. Deploy the workload and ScaledObject
Deploy the GPU workload and the KEDA ScaledObject that controls its scaling. Apply both manifests to the cluster.
**Workload Deployment**
```yaml theme={null}
apiVersion: apps/v1
kind: Deployment
metadata:
name: gpu-workload
spec:
replicas: 1
selector:
matchLabels:
app: gpu
template:
metadata:
labels:
app: gpu
spec:
containers:
- name: gpu-workload
image: registry.example.com/gpu-app:latest
command: ["/usr/bin/your-command"]
args: ["--argument-1", "--argument-2"]
resources:
limits:
nvidia.com/gpu: 8
```
**ScaledObject**
```yaml theme={null}
apiVersion: keda.sh/v1alpha1
kind: ScaledObject
metadata:
name: gpu-workload-scaledobject
spec:
scaleTargetRef:
name: gpu-workload
minReplicaCount: 1
maxReplicaCount: 16
triggers:
- type: prometheus
metadata:
serverAddress: http://prometheus-operated.prometheus:9090
metricName: gpu-utilization
threshold: "60"
query: sum(avg_over_time(DCGM_FI_DEV_GPU_UTIL{pod=~"gpu-workload.*"}[30s]))
```
The `DCGM_FI_DEV_GPU_UTIL` metric measures real-time GPU core utilization and is collected by the `nvidia-dcgm-exporter` installed in Step 3. Any metric from the [DCGM exporter](https://docs.nvidia.com/datacenter/dcgm/latest/dcgm-api/dcgm-api-field-ids.html) can be used in the `query` field instead.
The `{pod=~"gpu-workload.*"}` selector in the query filters metrics by pod name prefix. Update `gpu-workload` to match the actual workload name.
#### Parameters
Replace the example values in both manifests:
| Parameter | Description |
| ------------------------------------- | ---------------------------------------------------------------------------------------------------------------------------------------------------------- |
| `gpu-workload` | Unique name for the workload. Use the same value in `metadata.name` (Deployment), `spec.containers[].name`, and `spec.scaleTargetRef.name` (ScaledObject). |
| `registry.example.com/gpu-app:latest` | Container image URL. |
| `8` | Number of GPUs to allocate per container. |
| `1` / `16` | Minimum and maximum number of replicas. |
| `60` | GPU utilization percentage at which KEDA triggers scaling. |
| `gpu-utilization` | Unique identifier for the metrics series. |
## Verify scaling
Deploy the workload and confirm that KEDA, Cluster Autoscaler, and new GPU nodes respond correctly to GPU utilization changes.
### Step 8. Verify autoscaling
The autoscaling sequence has three phases: KEDA monitors GPU utilization and scales pods via the HPA, Cluster Autoscaler provisions new nodes when GPU capacity runs out, then new nodes join the cluster.
1. Monitor HPA in real time:
```sh theme={null}
kubectl get hpa -w
```
The expected output looks similar to this:
```sh theme={null}
NAME REFERENCE TARGETS MINPODS MAXPODS REPLICAS AGE
keda-hpa-gpu-workload-scaledobject Deployment/gpu-workload /60 (avg) 1 16 0 0s
keda-hpa-gpu-workload-scaledobject Deployment/gpu-workload 0/60 (avg) 1 16 1 16s
keda-hpa-gpu-workload-scaledobject Deployment/gpu-workload 23/60 (avg) 1 16 1 76s
....
keda-hpa-gpu-workload-scaledobject Deployment/gpu-workload 67750m/60 (avg) 1 16 8 10m
```
The system created eight pods to match the eight GPUs available on the server.
2. When pods exceed GPU capacity, Cluster Autoscaler requests new nodes. Run `kubectl get events -w` to observe provisioning events — node provisioning takes up to 20–25 minutes.
```sh theme={null}
....
0s Warning FailedScheduling pod/gpu-workload-...-dnzns 0/1 nodes are available: 1 Insufficient nvidia.com/gpu. preemption: 0/1 nodes are available: 1 No preemption victims found for incoming pod..
....
kube-system 69s Normal ScaledUpGroup configmap/cluster-autoscaler-status Scale-up: setting group MachineDeployment/.../gpu-workload-machine-deployment size to 2 instead of 1 (max: 2)
kube-system 69s Normal ScaledUpGroup configmap/cluster-autoscaler-status Scale-up: group MachineDeployment/.../gpu-workload-machine-deployment size set to 2 instead of 1 (max: 2)
```
3. Once the new node is ready, check pod status:
```sh theme={null}
kubectl get pods
```
The expected output looks similar to this:
```sh theme={null}
NAME READY STATUS RESTARTS AGE
apiserver-bridge-j7jk6 1/1 Running 0 141m
gpu-workload-9f866ff47-57zmg 1/1 Running 0 11m
gpu-workload-9f866ff47-5wxxb 1/1 Running 0 15m
gpu-workload-9f866ff47-8gkm8 1/1 Running 0 14m
gpu-workload-9f866ff47-9t4bv 1/1 Running 0 7m57s
gpu-workload-9f866ff47-dnzns 0/1 Pending 0 6m57s
gpu-workload-9f866ff47-fb5cs 0/1 Pending 0 6m57s
gpu-workload-9f866ff47-qthzr 1/1 Running 0 10m
gpu-workload-9f866ff47-rxm2c 1/1 Running 0 17m
gpu-workload-9f866ff47-tc8pq 1/1 Running 0 8m58s
gpu-workload-9f866ff47-zbt8d 1/1 Running 0 12m
```
Eight pods are running, and several have a `Pending` status while the new node initializes. After it is ready, the system scales up to the `maxReplicaCount` value.
After provisioning, it might take up to five minutes for NVIDIA GPU resources to become available in the cluster.
4. Check that the new node has joined the cluster:
```sh theme={null}
kubectl get nodes
```
```sh theme={null}
NAME STATUS ROLES AGE VERSION
ed-b16-78-161-160 Ready 166m v1.28.6
ed-b16-78-161-169 Ready 12m v1.28.6
```
5. Verify the final HPA status:
```sh theme={null}
kubectl get hpa
```
The expected output looks similar to this:
```sh theme={null}
NAME REFERENCE TARGETS MINPODS MAXPODS REPLICAS AGE
keda-hpa-gpu-workload-scaledobject Deployment/gpu-workload 71463m/60 (avg) 1 16 16 41m
```
When the utilization metric crosses the configured threshold — 60% in the example above — KEDA creates new pods up to the `maxReplicaCount` limit. If all GPUs are in use and no free resources are available, Kubernetes keeps the pods in `Pending` state, and Cluster Autoscaler provisions new nodes. Once new nodes are ready and GPUs are initialized (which might take 5 to 10 minutes), the pending pods start running.
5. Export Kubernetes configuration locally:
```sh theme={null}
export KUBECONFIG=/path/to/your/k8sConfig.yml
```
6. Verify that the node is ready:
```sh theme={null}
kubectl get nodes
```
The expected output looks similar to this:
```sh theme={null}
NAME STATUS ROLES AGE VERSION
ed-b16-82-160-248 Ready 3h26m v1.28.6
```
## Install dependencies
Install the GPU Operator to expose GPU resources, then KEDA and Prometheus to drive utilization-based scaling decisions.
### Step 3. Install GPU Operator
Use Helm to install the GPU Operator — the [official Helm docs](https://helm.sh/docs/intro/install/) cover installation for all platforms.
1. Add the NVIDIA Helm repository and update it:
```sh theme={null}
helm repo add nvidia https://helm.ngc.nvidia.com/nvidia && helm repo update
```
2. Install the GPU Operator. Use version `v23.9.1` for Kubernetes 1.28.x or `v23.9.2` for Kubernetes 1.29.x:
```sh theme={null}
helm install gpu-operator nvidia/gpu-operator --version v23.9.1 --wait \
-n gpu-operator --create-namespace \
--set driver.enabled=false \
--set operator.defaultRuntime=crio \
--set operator.logging.level=debug
```
Once installation completes, verify that GPUs are visible to Kubernetes before continuing.
### Step 4. Verify GPU allocation
1. Run `kubectl describe node ` and check the **Allocatable** section. The `nvidia.com/gpu` value must match the GPU count specified in the Bare Metal flavor.
```sh theme={null}
Allocatable:
cpu: 192
ephemeral-storage: 850152999143
hugepages-1Gi: 0
hugepages-2Mi: 0
memory: 2113338172Ki
nvidia.com/gpu: 8
pods: 110
```
2. Check that all GPU Operator pods have **READY** status:
```sh theme={null}
kubectl get pods -n gpu-operator
```
The expected output looks similar to this:
```sh theme={null}
NAME READY STATUS RESTARTS AGE
gpu-feature-discovery-f4knk 1/1 Running 0 3m9s
gpu-operator-f7ffcf7f8-sf8m7 1/1 Running 0 3m34s
gpu-operator-node-feature-discovery-gc-7cc7ccfff8-77g45 1/1 Running 0 3m34s
gpu-operator-node-feature-discovery-master-d8597d549-dnxz5 1/1 Running 0 3m34s
gpu-operator-node-feature-discovery-worker-rlf6p 1/1 Running 0 3m34s
nvidia-container-toolkit-daemonset-rl9p2 1/1 Running 0 3m1s
nvidia-cuda-validator-78g72 0/1 Completed 0 2m32s
nvidia-dcgm-exporter-nv9bk 1/1 Running 0 3m9s
nvidia-device-plugin-daemonset-4l5fl 1/1 Running 0 3m9s
nvidia-mig-manager-rqnsq 1/1 Running 0 26s
nvidia-operator-validator-n9rpz 1/1 Running 0 3m9s
```
3. Run a test GPU application using the NVIDIA [CUDA vectorAdd](https://docs.nvidia.com/datacenter/cloud-native/gpu-operator/latest/getting-started.html#cuda-vectoradd) example. Deploy the example workload and confirm it completes successfully before continuing.
### Step 5. Install KEDA
With GPU resources confirmed, install KEDA — it reads Prometheus metrics to determine when to create additional pods.
1. Add the KEDA Helm repository:
```sh theme={null}
helm repo add kedacore https://kedacore.github.io/charts
```
2. Update the repository:
```sh theme={null}
helm repo update
```
3. Install KEDA into its own namespace:
```sh theme={null}
helm install keda kedacore/keda --namespace keda --create-namespace
```
### Step 6. Install kube-prometheus-stack
KEDA relies on Prometheus metrics to trigger GPU-based scaling decisions. Install the [kube-prometheus-stack](https://github.com/prometheus-community/helm-charts/tree/main/charts/kube-prometheus-stack) to collect and expose those metrics.
1. Add the Prometheus Helm repository, update it, and save the default values:
```sh theme={null}
helm repo add prometheus-community https://prometheus-community.github.io/helm-charts
helm repo update
helm inspect values prometheus-community/kube-prometheus-stack > values.yaml
```
2. Create the `values-overrides.yaml` file with the following content:
```yaml theme={null}
serviceMonitorSelectorNilUsesHelmValues: false
additionalScrapeConfigs:
- job_name: gpu-metrics
scrape_interval: 1s
metrics_path: /metrics
scheme: http
kubernetes_sd_configs:
- role: endpoints
namespaces:
names:
- gpu-operator
relabel_configs:
- source_labels: [__meta_kubernetes_endpoints_name]
action: drop
regex: .*-node-feature-discovery-master
- source_labels: [__meta_kubernetes_pod_node_name]
action: replace
target_label: kubernetes_node
```
3. Install kube-prometheus-stack:
```sh theme={null}
helm install prometheus-community/kube-prometheus-stack \
--create-namespace --namespace prometheus \
--generate-name \
-f values.yaml -f values-overrides.yaml
```
The `values-overrides.yaml` overrides the default Prometheus configuration to define a scrape job that collects DCGM metrics from the `gpu-operator` namespace.
## Configure autoscaling
With metrics collection in place, create the workload and the ScaledObject that tells KEDA how to scale it.
### Step 7. Deploy the workload and ScaledObject
Deploy the GPU workload and the KEDA ScaledObject that controls its scaling. Apply both manifests to the cluster.
**Workload Deployment**
```yaml theme={null}
apiVersion: apps/v1
kind: Deployment
metadata:
name: gpu-workload
spec:
replicas: 1
selector:
matchLabels:
app: gpu
template:
metadata:
labels:
app: gpu
spec:
containers:
- name: gpu-workload
image: registry.example.com/gpu-app:latest
command: ["/usr/bin/your-command"]
args: ["--argument-1", "--argument-2"]
resources:
limits:
nvidia.com/gpu: 8
```
**ScaledObject**
```yaml theme={null}
apiVersion: keda.sh/v1alpha1
kind: ScaledObject
metadata:
name: gpu-workload-scaledobject
spec:
scaleTargetRef:
name: gpu-workload
minReplicaCount: 1
maxReplicaCount: 16
triggers:
- type: prometheus
metadata:
serverAddress: http://prometheus-operated.prometheus:9090
metricName: gpu-utilization
threshold: "60"
query: sum(avg_over_time(DCGM_FI_DEV_GPU_UTIL{pod=~"gpu-workload.*"}[30s]))
```
The `DCGM_FI_DEV_GPU_UTIL` metric measures real-time GPU core utilization and is collected by the `nvidia-dcgm-exporter` installed in Step 3. Any metric from the [DCGM exporter](https://docs.nvidia.com/datacenter/dcgm/latest/dcgm-api/dcgm-api-field-ids.html) can be used in the `query` field instead.
The `{pod=~"gpu-workload.*"}` selector in the query filters metrics by pod name prefix. Update `gpu-workload` to match the actual workload name.
#### Parameters
Replace the example values in both manifests:
| Parameter | Description |
| ------------------------------------- | ---------------------------------------------------------------------------------------------------------------------------------------------------------- |
| `gpu-workload` | Unique name for the workload. Use the same value in `metadata.name` (Deployment), `spec.containers[].name`, and `spec.scaleTargetRef.name` (ScaledObject). |
| `registry.example.com/gpu-app:latest` | Container image URL. |
| `8` | Number of GPUs to allocate per container. |
| `1` / `16` | Minimum and maximum number of replicas. |
| `60` | GPU utilization percentage at which KEDA triggers scaling. |
| `gpu-utilization` | Unique identifier for the metrics series. |
## Verify scaling
Deploy the workload and confirm that KEDA, Cluster Autoscaler, and new GPU nodes respond correctly to GPU utilization changes.
### Step 8. Verify autoscaling
The autoscaling sequence has three phases: KEDA monitors GPU utilization and scales pods via the HPA, Cluster Autoscaler provisions new nodes when GPU capacity runs out, then new nodes join the cluster.
1. Monitor HPA in real time:
```sh theme={null}
kubectl get hpa -w
```
The expected output looks similar to this:
```sh theme={null}
NAME REFERENCE TARGETS MINPODS MAXPODS REPLICAS AGE
keda-hpa-gpu-workload-scaledobject Deployment/gpu-workload /60 (avg) 1 16 0 0s
keda-hpa-gpu-workload-scaledobject Deployment/gpu-workload 0/60 (avg) 1 16 1 16s
keda-hpa-gpu-workload-scaledobject Deployment/gpu-workload 23/60 (avg) 1 16 1 76s
....
keda-hpa-gpu-workload-scaledobject Deployment/gpu-workload 67750m/60 (avg) 1 16 8 10m
```
The system created eight pods to match the eight GPUs available on the server.
2. When pods exceed GPU capacity, Cluster Autoscaler requests new nodes. Run `kubectl get events -w` to observe provisioning events — node provisioning takes up to 20–25 minutes.
```sh theme={null}
....
0s Warning FailedScheduling pod/gpu-workload-...-dnzns 0/1 nodes are available: 1 Insufficient nvidia.com/gpu. preemption: 0/1 nodes are available: 1 No preemption victims found for incoming pod..
....
kube-system 69s Normal ScaledUpGroup configmap/cluster-autoscaler-status Scale-up: setting group MachineDeployment/.../gpu-workload-machine-deployment size to 2 instead of 1 (max: 2)
kube-system 69s Normal ScaledUpGroup configmap/cluster-autoscaler-status Scale-up: group MachineDeployment/.../gpu-workload-machine-deployment size set to 2 instead of 1 (max: 2)
```
3. Once the new node is ready, check pod status:
```sh theme={null}
kubectl get pods
```
The expected output looks similar to this:
```sh theme={null}
NAME READY STATUS RESTARTS AGE
apiserver-bridge-j7jk6 1/1 Running 0 141m
gpu-workload-9f866ff47-57zmg 1/1 Running 0 11m
gpu-workload-9f866ff47-5wxxb 1/1 Running 0 15m
gpu-workload-9f866ff47-8gkm8 1/1 Running 0 14m
gpu-workload-9f866ff47-9t4bv 1/1 Running 0 7m57s
gpu-workload-9f866ff47-dnzns 0/1 Pending 0 6m57s
gpu-workload-9f866ff47-fb5cs 0/1 Pending 0 6m57s
gpu-workload-9f866ff47-qthzr 1/1 Running 0 10m
gpu-workload-9f866ff47-rxm2c 1/1 Running 0 17m
gpu-workload-9f866ff47-tc8pq 1/1 Running 0 8m58s
gpu-workload-9f866ff47-zbt8d 1/1 Running 0 12m
```
Eight pods are running, and several have a `Pending` status while the new node initializes. After it is ready, the system scales up to the `maxReplicaCount` value.
After provisioning, it might take up to five minutes for NVIDIA GPU resources to become available in the cluster.
4. Check that the new node has joined the cluster:
```sh theme={null}
kubectl get nodes
```
```sh theme={null}
NAME STATUS ROLES AGE VERSION
ed-b16-78-161-160 Ready 166m v1.28.6
ed-b16-78-161-169 Ready 12m v1.28.6
```
5. Verify the final HPA status:
```sh theme={null}
kubectl get hpa
```
The expected output looks similar to this:
```sh theme={null}
NAME REFERENCE TARGETS MINPODS MAXPODS REPLICAS AGE
keda-hpa-gpu-workload-scaledobject Deployment/gpu-workload 71463m/60 (avg) 1 16 16 41m
```
When the utilization metric crosses the configured threshold — 60% in the example above — KEDA creates new pods up to the `maxReplicaCount` limit. If all GPUs are in use and no free resources are available, Kubernetes keeps the pods in `Pending` state, and Cluster Autoscaler provisions new nodes. Once new nodes are ready and GPUs are initialized (which might take 5 to 10 minutes), the pending pods start running.