> ## Documentation Index
> Fetch the complete documentation index at: https://docs.gcore.com/llms.txt
> Use this file to discover all available pages before exploring further.
# Monitor load on a specific node
The **Monitoring** tab displays performance metrics for a Kubernetes worker node.
To open node monitoring, a [Kubernetes cluster](/cloud/kubernetes/clusters/create-a-kubernetes-cluster) with at least one pool and one worker node must already exist in the selected region.
## Navigate to monitoring
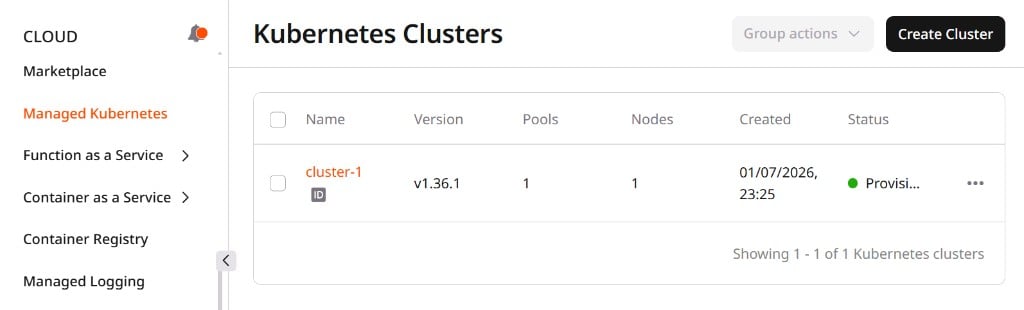
1. In the [Gcore Customer Portal](https://portal.gcore.com), navigate to **Cloud** > **Managed Kubernetes** and click the cluster name.
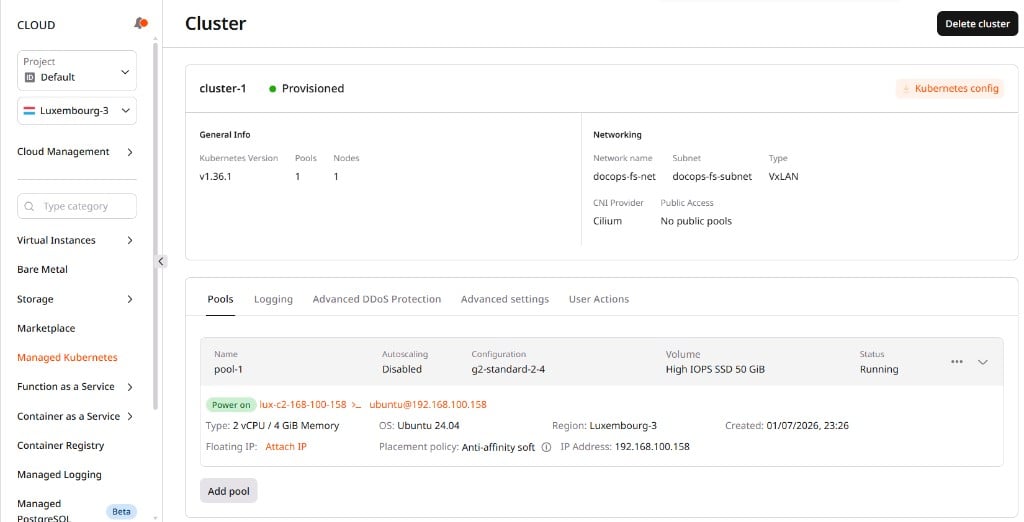
 2. On the cluster page, open the **Pools** tab and click the node name.
 3. On the node details panel, select the **Monitoring** tab.
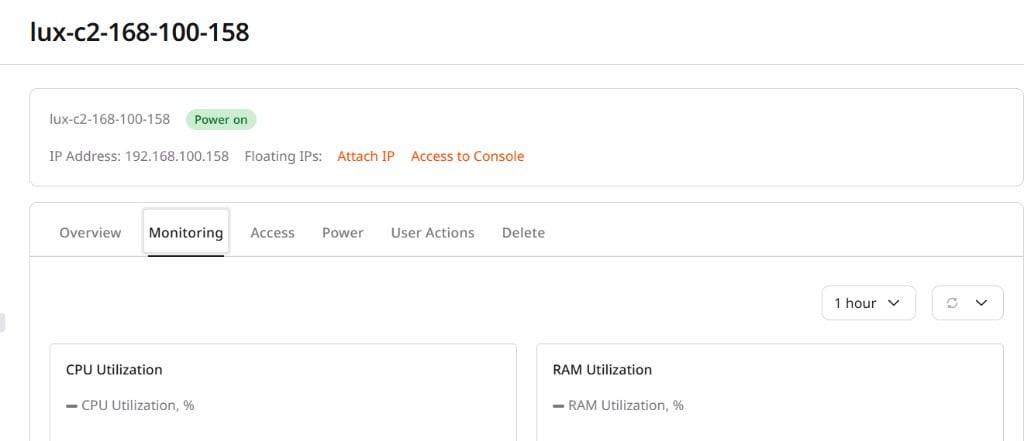 Two controls appear above the graphs — the left one selects the time range of the displayed data, and the right one sets the refresh interval.
Rate metrics — bytes per second and packets per second — display one-minute averages. The system collects the total volume for one minute and divides by 60.
## Metrics
The Monitoring tab shows four metrics for the selected worker node:
1. **CPU Utilization** measures the load on the node processor as a percentage. At 90% load across all cores, the graph displays 90%.
2. **RAM Utilization** measures the amount of RAM the worker node uses, as a percentage. A value of 100% means the RAM is fully loaded.
RAM Utilization in the portal may be higher than the value shown inside the operating system. The Monitoring tab includes cache RAM — memory the OS reserves to speed up applications but reclaims immediately when any application requires it.
3. **Network Traffic** shows network traffic speed. **Network BPS, ingress** is incoming traffic in bytes per second, and **Network BPS, egress** is outgoing traffic in bytes per second.
4. **Network Packets** shows network traffic in packets per second. **Network PPS, ingress** is incoming traffic in packets per second, and **Network PPS, egress** is outgoing traffic in packets per second.
Two controls appear above the graphs — the left one selects the time range of the displayed data, and the right one sets the refresh interval.
Rate metrics — bytes per second and packets per second — display one-minute averages. The system collects the total volume for one minute and divides by 60.
## Metrics
The Monitoring tab shows four metrics for the selected worker node:
1. **CPU Utilization** measures the load on the node processor as a percentage. At 90% load across all cores, the graph displays 90%.
2. **RAM Utilization** measures the amount of RAM the worker node uses, as a percentage. A value of 100% means the RAM is fully loaded.
RAM Utilization in the portal may be higher than the value shown inside the operating system. The Monitoring tab includes cache RAM — memory the OS reserves to speed up applications but reclaims immediately when any application requires it.
3. **Network Traffic** shows network traffic speed. **Network BPS, ingress** is incoming traffic in bytes per second, and **Network BPS, egress** is outgoing traffic in bytes per second.
4. **Network Packets** shows network traffic in packets per second. **Network PPS, ingress** is incoming traffic in packets per second, and **Network PPS, egress** is outgoing traffic in packets per second.