> ## Documentation Index
> Fetch the complete documentation index at: https://docs.gcore.com/llms.txt
> Use this file to discover all available pages before exploring further.
# Check storages usage reports
Storage usage metrics — used space, requests, traffic, and number of objects — are available in the **Statistics** section of the [Gcore Customer Portal](https://portal.gcore.com) and used for billing.
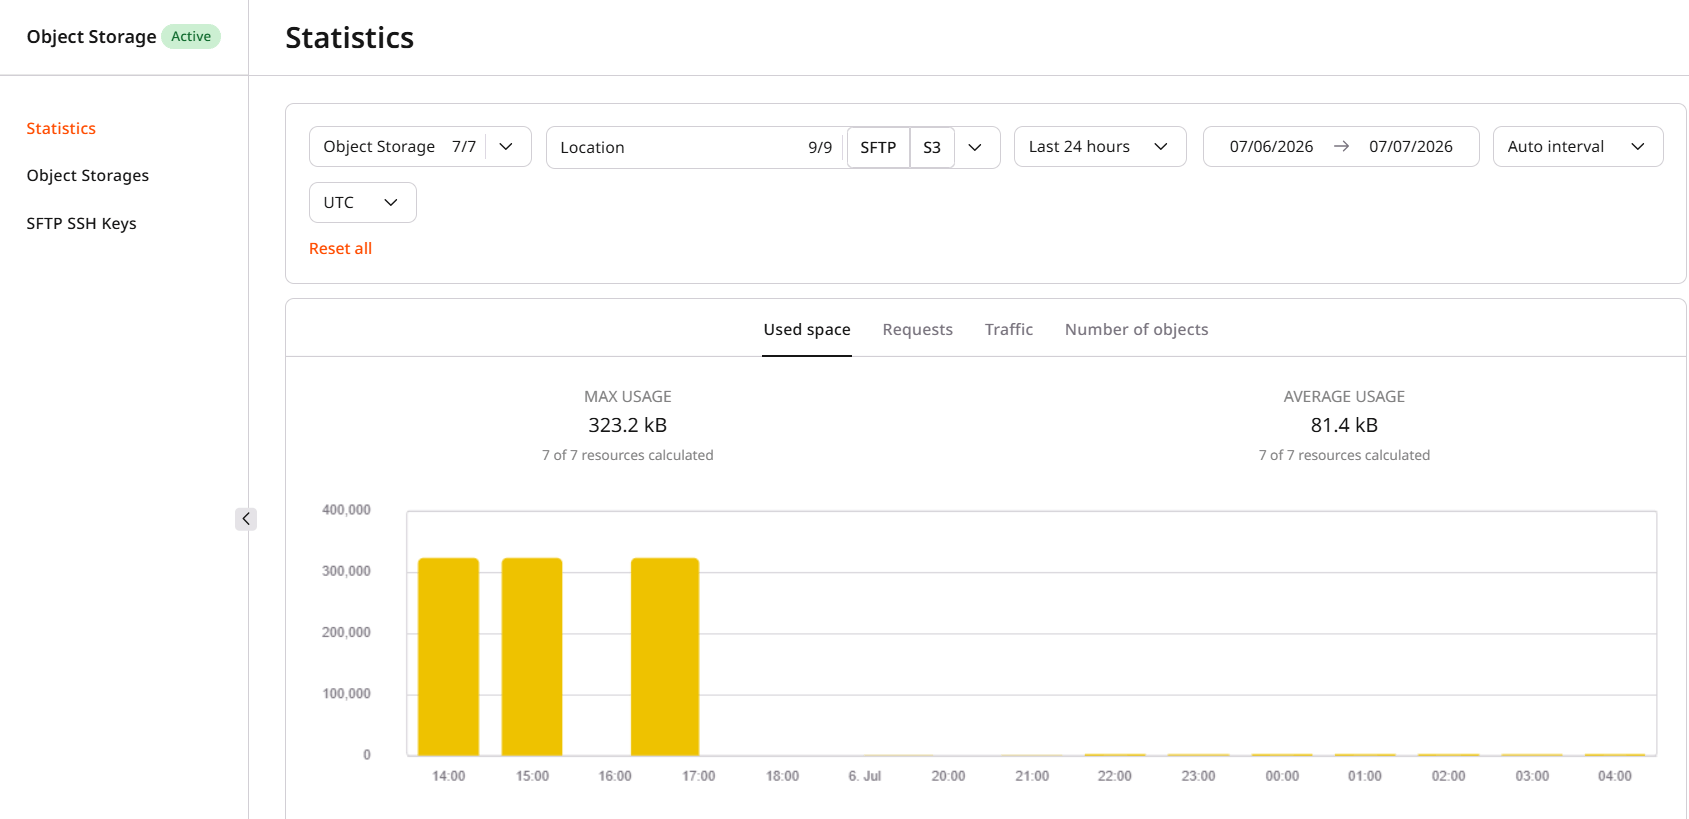
The page supports filtering by time period (last 24 hours, last 48 hours, last week, last month, last year, or a custom date range), storage type (S3 or SFTP), location, and storage name. The **Used space** tab shows max and average usage for the selected period:
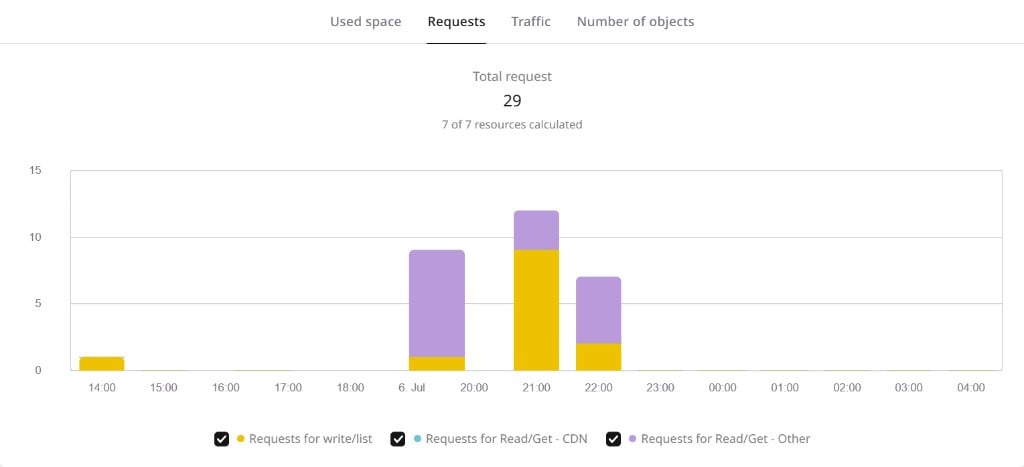
 The **Requests** tab shows total request count broken down into write/list requests, Read/Get via CDN, and Read/Get via other sources:
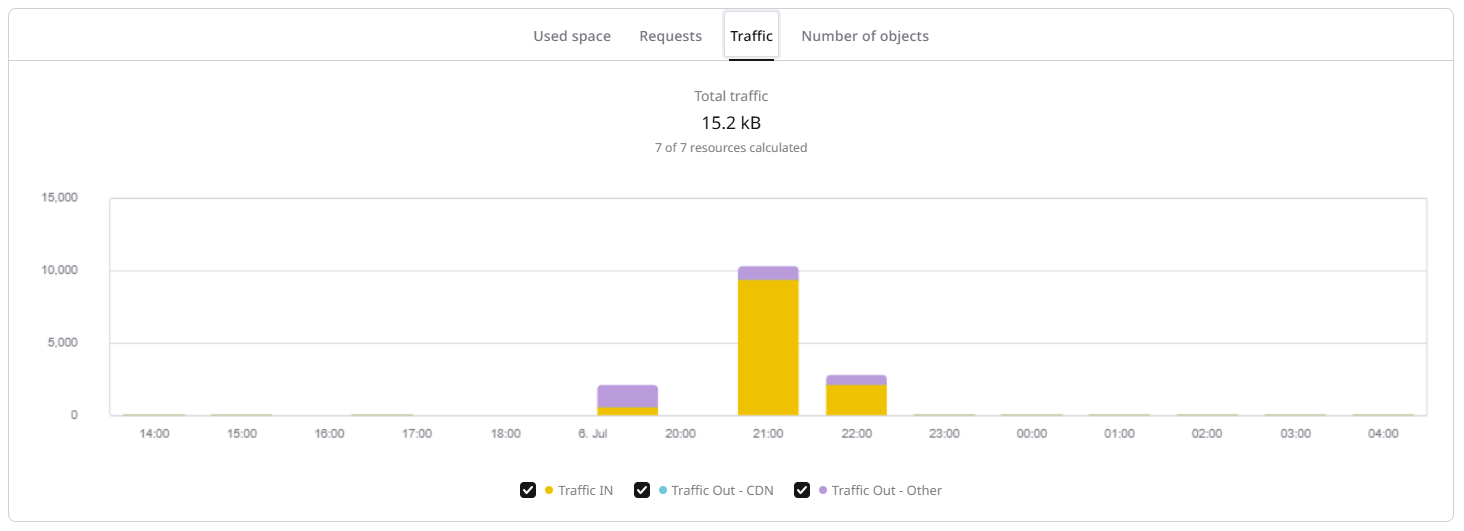
 The **Traffic** tab breaks traffic down into Traffic IN, Traffic Out - CDN, and Traffic Out - Other:
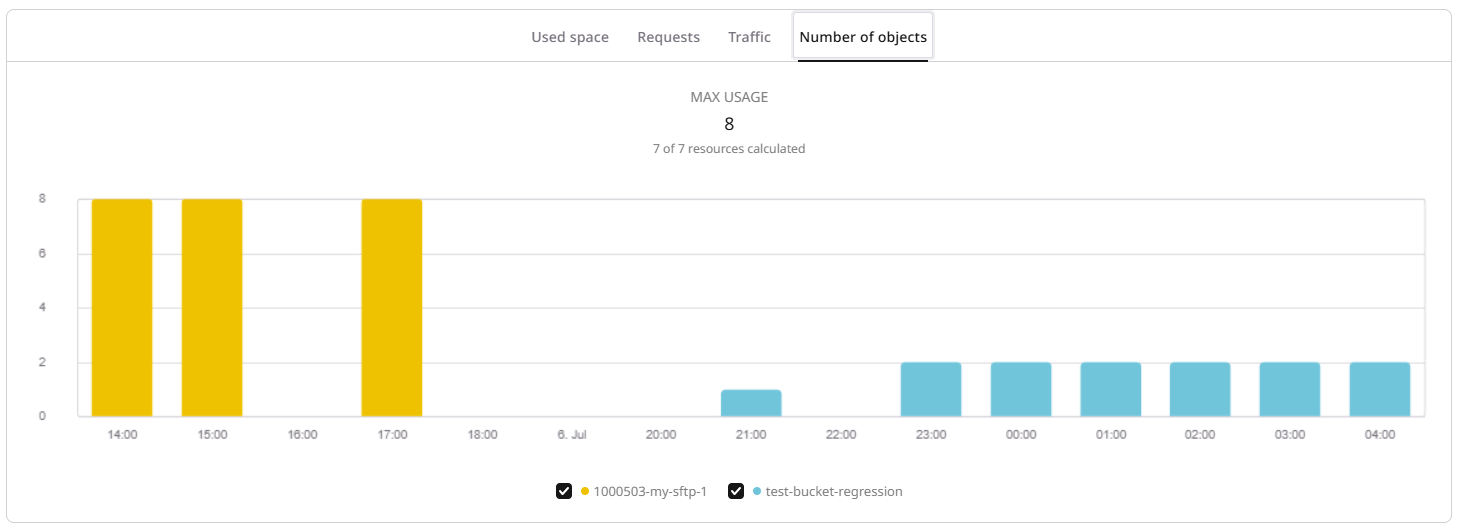
 The **Number of objects** tab shows the maximum object count per storage for the selected period:
 Statistics are not available immediately — data appears in the portal within a couple of hours after storage creation. Requests for longer periods — a year of data — may take more time to process.
Used space is rounded to the nearest whole GB for billing. For SFTP storage, system files — SSH keys, empty directories, and a `robots.txt` file — account for about 350 kB of used space. If a storage was created but no files have been uploaded, statistics will reflect only this system-file space.
Statistics are not available immediately — data appears in the portal within a couple of hours after storage creation. Requests for longer periods — a year of data — may take more time to process.
Used space is rounded to the nearest whole GB for billing. For SFTP storage, system files — SSH keys, empty directories, and a `robots.txt` file — account for about 350 kB of used space. If a storage was created but no files have been uploaded, statistics will reflect only this system-file space.