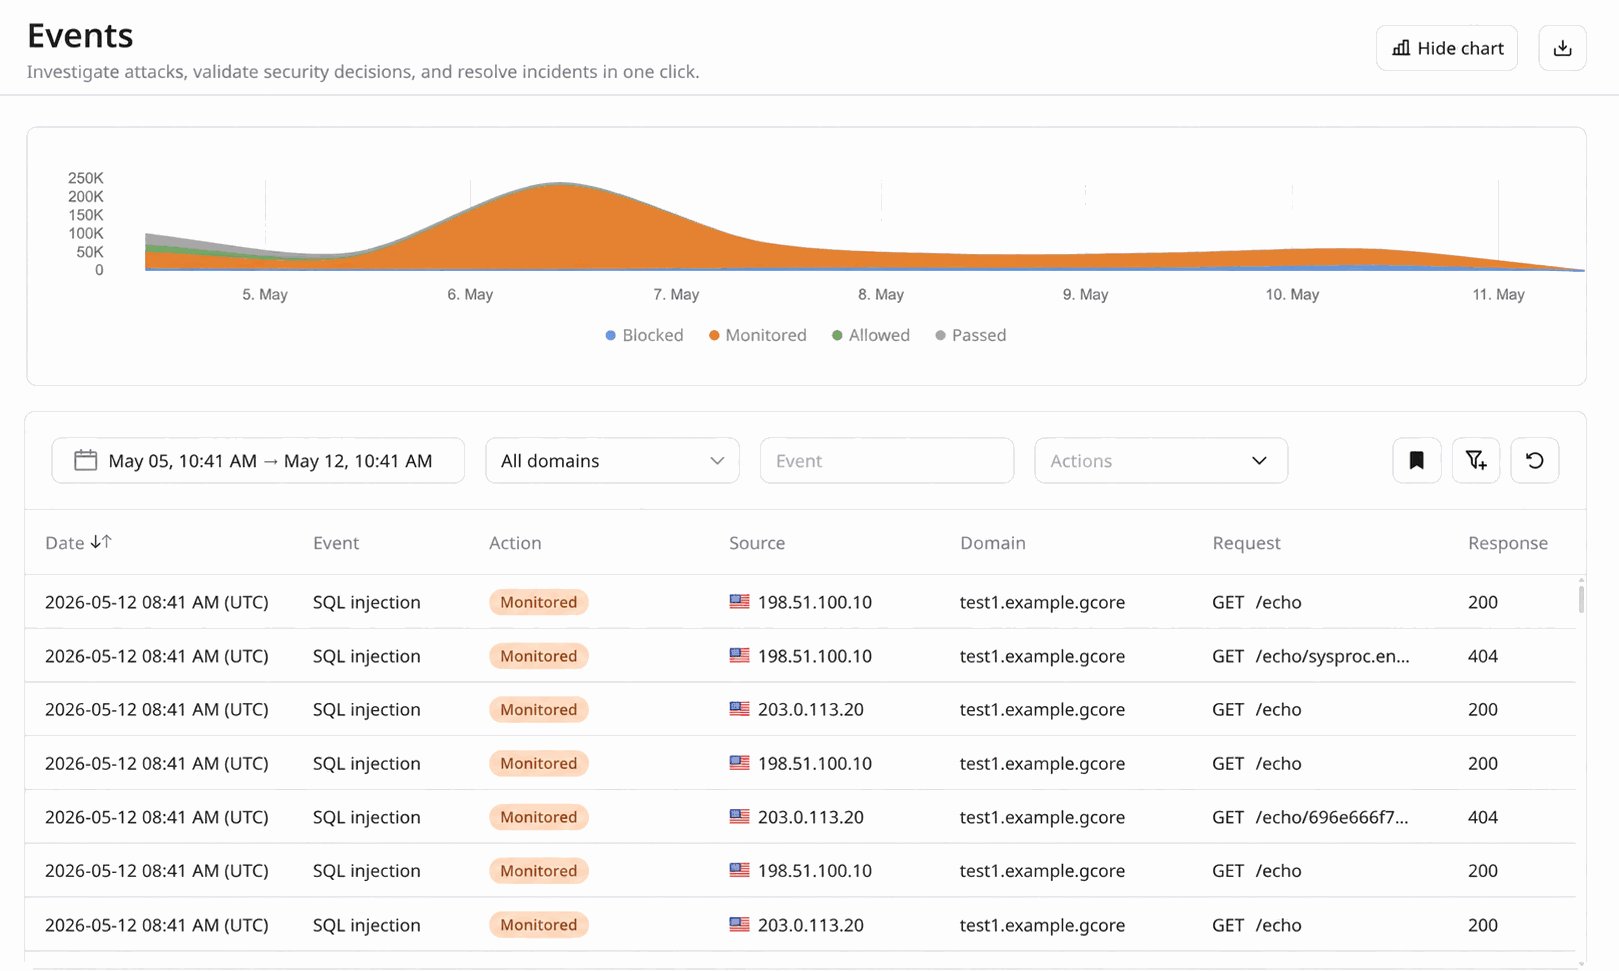
The **Events** section provides detailed visibility into HTTP requests and security events processed by WAAP. It serves as the primary workspace for traffic investigation, security analysis, and policy validation.
Events allow teams to move from high-level attack patterns to individual requests, sessions, and security signals.
Request history is retained for 30 days.
 ## Why filtering matters
In production environments, raw request logs are too large to analyze manually. The Events interface is designed around flexible, filter-driven investigation, allowing analysts to quickly reduce large traffic volumes to a meaningful investigative scope.
By default, only the most commonly used filters are displayed in the toolbar, including:
* **Time range** — isolate the exact period when suspicious activity occurred. * **Domain** — focus the investigation on traffic targeting all domains, or a specific domain. * **Event** — focus on specific security signals or detections. * **Decision** — filter requests based on the mitigation decision applied by WAAP. Available values include: * **Blocked** — malicious traffic that was denied and did not reach the origin, according to the active security rules. * **Monitored** — malicious traffic that was detected but intentionally allowed to pass according to the current security policy (for example when rules operate in monitoring mode). * **Allowed** — traffic explicitly permitted by user-defined policies or allow rules. * **Passed** — legitimate traffic that was inspected and forwarded to the origin because it did not trigger blocking policies. * **Optional Action** — filter requests by a challenge applied in addition to the primary decision. Available values include: * **CAPTCHA** — a CAPTCHA challenge was issued to the client request. * **JS Challenge** — a JavaScript or browser validation challenge was issued. **Optional Action** filters can be combined with **Decision** filters. For example, selecting **Decision**: **Blocked** and **Optional Action**: **CAPTCHA** returns requests that were blocked after failing a CAPTCHA challenge.Additional filters can be added dynamically using the **Add filter** button.
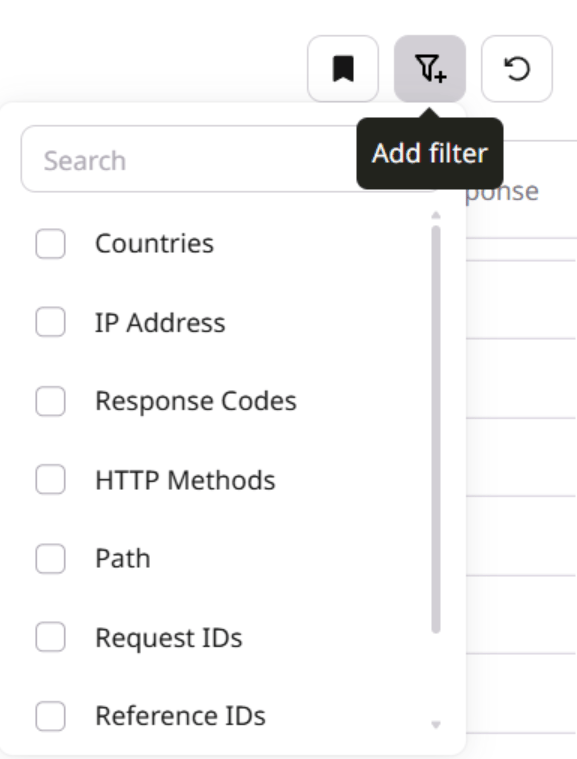
Filters can be combined to progressively narrow the dataset and focus on the exact traffic relevant to an incident or investigation.
* **Countries** — analyze traffic based on geographic origin. * **IP address** — investigate activity from a specific client. * **Response Codes** — correlate security events with application behavior. * **HTTP Methods** — distinguish between request types such as GET, POST, PUT, PATCH, or DELETE. * **Path** — focus on a particular application endpoint or API route. * **Request ID** — inspect one or more specific requests. Multiple request IDs can be provided as a comma-separated list. * **Reference IDs** — group repeated requests that triggered the same security rule. Multiple reference IDs can be provided as a comma-separated list. * **Session IDs** — analyze sequences of requests generated within one client session. Multiple session IDs can be provided as a comma-separated list. * **JA3** — filter by the [JA3 TLS fingerprint](/waap/threat-intelligence/tls-fingerprinting) of the originating client. Useful for identifying botnets that share a common network stack regardless of IP address.Because filters can be combined, analysts can move from broad analysis to highly precise investigations — for example isolating POST requests to `/login` from a specific country that were blocked during a five-minute attack window.
Filtered datasets are immediately reflected in the Events analytics view. Graphs dynamically update to display:
* the volume of requests over time within the selected scope. * the distribution of decisions (Blocked, Monitored, Allowed, Passed) and optional actions (CAPTCHA, JS Challenge). * the relationship between suspicious and legitimate traffic for the selected filters.This dynamic filtering makes Events a practical investigation workspace rather than a static log viewer. Analysts can quickly test hypotheses, validate rule behavior, and understand how attacks evolve over time.
Security analysts, SREs, and DevSecOps engineers typically use Events to:
* investigate suspicious traffic. * validate enforcement actions. * detect recurring attack patterns. * confirm whether rules behave as expected. * export evidence for incident response. ## Inspecting an individual eventFiltering narrows the dataset, but the deepest context lives inside each request. Clicking an event in the list expands the event row to reveal additional detail beyond the columns shown in the table, helping analysts understand why a request was flagged and where it originated.
Two of the most security-relevant fields in the expanded view are:
* **Organization** — the name of the organization that owns the client IP address, sourced from WHOIS data. This helps analysts attribute traffic to a hosting provider, cloud platform, ISP, or corporate network, which is often a strong signal when distinguishing legitimate users from automated or malicious infrastructure. * **Tags** — threat category labels assigned by WAAP, such as *Injection Attack* or *SQL Injection*. Tags reflect the high-level threat classification detected for the request, giving analysts an immediate understanding of the type of threat behind a security event without inspecting the raw payload.Together, these fields turn a single event into actionable context: Organization indicates *who* the request came from, while Tags explain *why* WAAP considered it suspicious.
## Exporting eventsWAAP provides multiple ways to export security events for reporting, long-term storage, or integration with external security systems.
### Export from the Events pageEvents visible in the Events interface can be exported directly as a report. When filters are applied, the exported dataset contains only the filtered results, allowing analysts to generate focused reports for investigations or incident documentation.
Typical use cases include:
* sharing traffic samples with SOC or incident response teams. * attaching evidence to security incident records. * providing filtered datasets to engineering teams for troubleshooting. * preparing customer-facing security reports.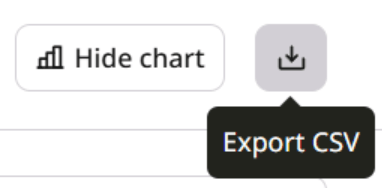
Exports from the Events page are typically provided in CSV format, making them easy to process in spreadsheets, SIEM platforms, or analytical tools.
### Continuous export via Log UploaderFor automated pipelines and long-term retention, WAAP supports continuous event delivery using Log Uploader.
Log Uploader allows teams to stream WAAP events to external storage or processing systems. Supported destinations include:
* Amazon S3 — for centralized log storage and integration with data lakes or analytics pipelines. * FTP — for compatibility with legacy log ingestion systems. * SFTP — for secure file transfer to security or compliance infrastructure. * HTTP endpoints — for integration with SIEM platforms, log collectors, or custom processing services.This capability allows organizations to integrate WAAP telemetry into broader security monitoring, DevSecOps, and observability pipelines, enabling correlation with application logs, infrastructure metrics, and threat intelligence systems.
## Real-world investigation scenarios ### Investigating an API attackA backend team notices abnormal behavior on `/api/login`. A security analyst opens Events and filters traffic by time range, path, and HTTP method.
The filtered dataset reveals a burst of POST requests from a limited set of IP addresses, triggering authentication-related rules. The analyst confirms that WAAP blocked the majority of these requests and identifies the activity as credential-stuffing automation.
### Distinguishing legitimate automation from malicious botsSome services rely on legitimate automated traffic from partners or internal integrations. However, malicious bots may produce similar patterns.
By filtering events by country, session ID, and decision, analysts can distinguish legitimate automation from abusive scripts attempting to scrape content or overload endpoints.
### Validating a new security ruleAfter deploying a new custom rule, a DevSecOps engineer reviews Events to confirm that the rule correctly identifies malicious requests without affecting legitimate traffic.
The analyst filters by time range and decision to review blocked versus allowed requests and confirm that the policy change behaves as intended.
### Investigating repeated attacker behaviorAutomated attacks often generate sequences of requests rather than isolated events.
By pivoting from an IP address to a session ID or reference ID, analysts can observe the full sequence of requests generated by a single automated workflow. This helps determine whether the attacker is scanning, probing authentication flows, or attempting exploitation.
### Exporting evidence for incident responseOnce relevant traffic is isolated, analysts can export the filtered dataset in CSV format.
This allows teams to:
* attach traffic samples to incident reports. * share evidence with SOC teams. * provide technical context to engineering teams. * document mitigation effectiveness. ## Recommended investigation workflowA typical investigation process in Events includes:
1. Narrow the timeframe of the incident. 2. Identify the affected endpoint or domain. 3. Review mitigation decisions taken by WAAP. 4. Pivot to source indicators such as IP address or session ID. 5. Export relevant events for documentation or response.This structured approach allows teams to transform raw request telemetry into actionable security insight.
Query the request log and retrieve individual event details using the [Analytics](/api-reference/waap#analytics) endpoints. The [Python](/developer-tools/sdks/python) and [Go](/developer-tools/sdks/go) SDKs cover the list endpoint. Response examples include only the fields used in each step.
Set the API token before running the examples:
```bash theme={null} export GCORE_API_KEY="{YOUR_API_KEY}" ``` ## List eventsThe `GET /waap/v1/analytics/requests` endpoint returns the request log across all domains in the account. Each record includes the client IP address, triggered rule, decision, and request metadata. Results older than 30 days are not available.
Retrieve the full set of attributes for a specific event, including request headers, user agent details, session context, the incident ID from any challenge that was issued, and the threat category tags that explain why the request was flagged.
The `request_id` value comes from the `id` field in the events list response. The `domain_id` is also present in each list result.
```bash theme={null} curl -X GET "https://api.gcore.com/waap/v1/domains/{DOMAIN_ID}/requests/{REQUEST_ID}/details" \ -H "Authorization: APIKey $GCORE_API_KEY" ```The API returns:
```json theme={null} { "id": "01jfad3x...", "path": "/api/login", "method": "POST", "action": "block", "decision": "blocked", "optional_action": "", "rule_id": "rule-4821", "rule_name": "SQL Injection", "pattern_matched_tags": ["Injection Attack", "SQL Injection"], "common_tags": [], "traffic_types": ["malicious"], "user_agent": { "raw": "python-requests/2.31.0", "device": "Other", "client": "Python Requests" }, "network": { "ip": "203.0.113.45", "organization": "Example Hosting LLC" }, "request_time": "2026-06-24T10:30:00Z", "reference_id": "ref-abc123", "session_id": "sess-xyz789", "query_string": "user=admin&pass=1%27+OR+1%3D1", "http_status_code": 403, "http_version": "HTTP/1.1", "scheme": "https", "content_type": "application/json", "response_time": "12ms", "incident_id": "", "request_headers": { "Host": "example.com", "Content-Type": "application/json" } } ```