Cloud resource usage and associated costs are available on the Cost reports pages in the Gcore Customer Portal. To access them, navigate to Cloud, open a project, then select Cloud Management in the left sidebar and click Cost Report or Reservation Cost Report. The Customer Portal provides two reports:
  • Cost Report — costs for all Cloud resources used, calculated at Pay-As-You-Go rates. If active resource commitments exist, the prices shown don’t reflect actual costs because commit discounts are not applied.
  • Reservation Cost Report — monthly resource usage and costs that account for resource commitments. This report shows how much of the committed resources were consumed, whether commits were fully utilized, and any overcommit costs incurred when usage exceeded the reserved amount.
Reports are also available via the API. Statistics for the last hour may contain incomplete data — for accurate results, review data collected more than an hour ago.

Cost Report

This report calculates all costs using Pay-As-You-Go rates and doesn’t account for resource commitments. If active commits exist, the prices shown won’t reflect actual costs. Check the Reservation Cost Report for cost data that includes commit discounts.
The report contains data about each Cloud resource in use, helping estimate future pay-as-you-go costs. The cost data can be filtered by:
  • Project — view costs for all projects or a selected subset. Deleted projects appear in the Project dropdown with a (Deleted) label and can be selected like active ones.
  • Regions — filter by the region where resources were created.
  • Types — filter by resource type.
  • Tags — filter by tags assigned to resources.
  • Consumption period — view costs for 1 week, 2 weeks, or a custom date range. The maximum custom period is one month.
Projects dropdown with deleted projects visible
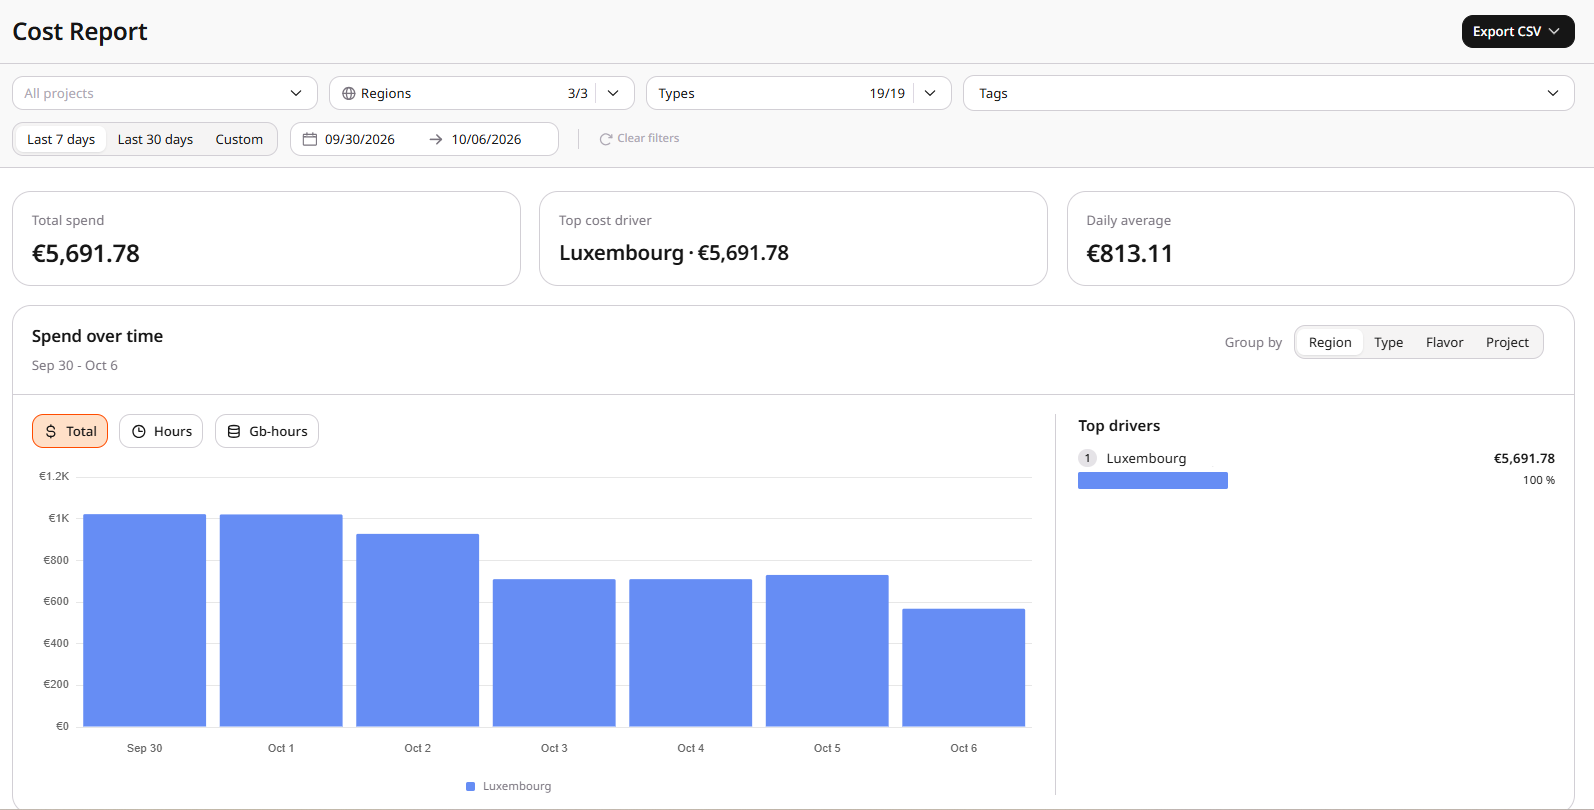
Use the Rounding checkbox in the top-right corner to toggle cost rounding on or off. After applying filters, cost statistics are displayed in a graph and table format. In the graph view, the Total € tab displays the cumulative costs associated with each Cloud resource.
Cost report graph with resource usage
More granular statistics are available on the following tabs:
  • Hours
  • Gigabyte-hours
  • Gigabyte-minutes
  • Gigabyte-seconds
  • Millions
  • Gigabytes
  • Flavors, hours
Under the graph, a table lists resources consumed within the selected period with the following properties:
  • Resource name
  • Resource type
  • Region
  • Project
  • Tags
  • Usage
  • First seen date
  • Last seen date
  • Cost
A table with resources overview
To refine table results, filter by resource type and attribute, or use the search field. Only full-text search is supported. To filter table data: 1. In the Type field, select the resource type. For example, select External IP.
Resource type dropdown with External IP selected
2. In the Field dropdown, select the relevant resource attribute. For example, to view Cost Report data for a particular IP address, select IP Address.
Resource attribute dropdown with IP Address selected
3. In the search field, enter the IP address. The table data and graph above the table will be updated accordingly.
Example of table and graph updated for External IP address

Cost Report export

To export data for the selected period, click Export CSV in the top-right corner. Two file types are available:
  • Detailed — a detailed breakdown of each resource.
  • Totals — the total cost of resources in each location.
Export CSV dropdown with Detailed and Totals options

The following table describes the columns in the Detailed CSV export.
ColumnDescription
ServiceName of the Cloud resource.
UUIDUniversally unique identifier assigned to the resource. Some resources, like IP addresses, don’t have a UUID as they’re already unique.
FeatureBilling identifier that combines resource type, configuration, region, and pricing model. Every resource has a feature value, including resources with a single configuration like IP addresses.
TagsTags added to the resource, including system-generated tags.
Service_nameName of the service as displayed in the Name field in the portal. For example, the name of a Virtual Machine.
Region_idID of the region where the resource was created. Check the ID via the API.
Region_nameName of the geographical location of the data center where the resource was created.
Project_idID of the project where the resource was created. The project ID is visible on the Projects page in the grid view.
Project_nameName of the project where the resource was created.
First_seenDate when the resource was first detected in the billing system during the selected period. Identifies when a resource started generating costs.
Last_seenDate when the resource was last detected in the billing system during the selected period. Identifies when a resource stopped generating costs, though it doesn’t necessarily indicate the resource was deleted.
Period_fromStart date of the reporting period. Reflects the selected date range, not when the resource was created.
Period_toEnd date of the reporting period. Reflects the selected date range, not when the resource was stopped or deleted.
UnitsConsumption measurement unit — either usage time (gbminutes, minutes, milliseconds) or consumed quantity (bytes, GBS).
ValueNumerical measurement of resource usage.
ErrorAny errors associated with costs incurred during the specified period.
CostCost of the resource for the specified period.
CurrencyCurrency in which the cost is calculated.
Attached_toCloud product to which the resource is connected. For example, the ID of a Virtual Machine that a volume is attached to.
Port_idUnique identifier for a network virtual port of a VM, used to associate IP addresses and traffic with specific network connections.

Reservation Cost Report

The Reservation Cost Report presents monthly usage and costs for prepaid and reserved resources, showing commit utilization and any overcommit charges. Data is grouped by resource type and feature. The cost data can be filtered by:
  • Regions — filter by the region where resources were created.
  • Types — filter by resource type.
  • Consumption period — select a specific month.
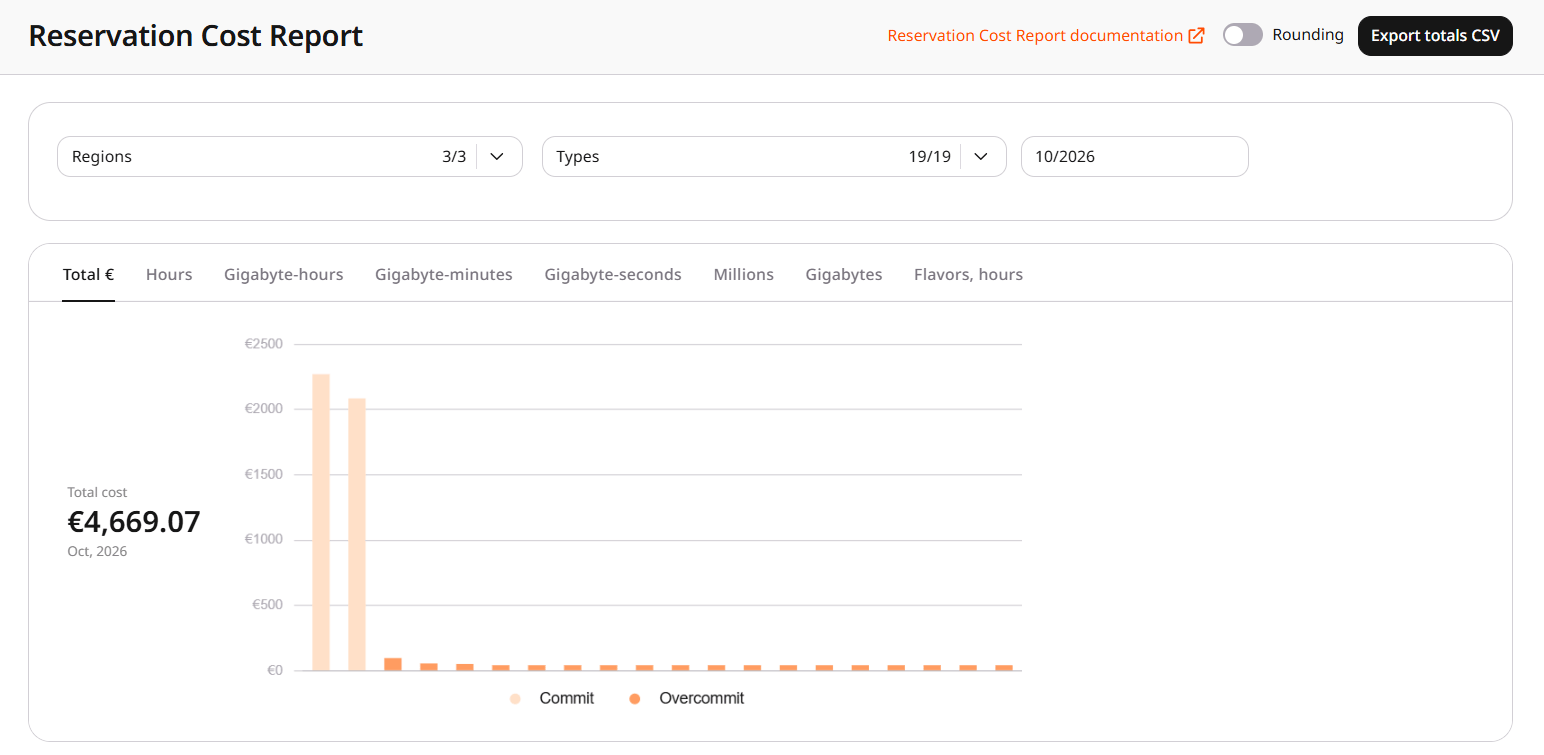
The report includes statistics for all regions, including deleted ones. Use the Rounding checkbox in the top-right corner to toggle cost rounding on or off. Cost data is displayed as a chart and a table. In the chart view, the Total € tab displays the cumulative costs for the selected period.
Reservation Cost Report graph
More granular information is available on the following tabs:
  • Hours
  • Gigabyte-hours
  • Gigabyte-minutes
  • Gigabyte-seconds
  • Millions
  • Gigabytes
  • Flavors, hours
Under the chart, the table shows a detailed breakdown of resources consumed during the selected month. The table includes the following columns:
  • Resource type — the type of Cloud resource.
  • Feature name — the billing identifier that combines resource type, configuration, region, and pricing model.
  • Region — the region where the resource is located.
  • Usage — the amount of resource consumed.
  • Cost — the cost for the selected period.

Reservation Cost Report export

To export the billing report for the selected period, click Export totals CSV in the top-right corner.
Export Reservation Cost Report button
The following table describes the columns in the Totals CSV export for reserved resources.
ColumnDescription
TypeCloud resource type.
FeatureBilling identifier that combines resource type, configuration, region, and pricing model. Every resource has a feature value, including resources with a single configuration like IP addresses.
Region_idID of the region where the resource is reserved. Check the ID via the API.
Region_nameName of the geographical location of the data center where the resource is reserved.
PeriodTimeframe for the displayed statistics.
UnitsConsumption measurement unit — either usage time (gbminutes, minutes, milliseconds) or consumed quantity (bytes, GBS).
ValueTotal consumed value.
Commit valueTotal amount of resources reserved.
Commit costCost for the reserved amount of Cloud resources.
Overcommit costAdditional charges incurred when resource usage exceeded the committed (reserved) amount.
ErrorAny errors associated with costs incurred during the specified period.
CurrencyCurrency in which the cost is calculated.