Traffic Analytics access
The page is under DDoS Protection reports. The steps below open it and apply a time range or destination IP.1
Open Traffic Analytics
In the Gcore Customer Portal, navigate to DDoS Protection → Reports → Traffic Analytics.
2
Narrow the time range or destination IP
Select a time preset or a custom range. Use Search by IP address to filter by destination IP.
Summary cards and charts
Summary cards aggregate traffic for the selected window. Rate cards use bits per second (bps); Event Count is a count of incidents.- Inbound (Max) — peak traffic received toward the protected resource before filtering, as the maximum rate in the window.
- Outbound (Max) — peak traffic sent from the protected resource, as the maximum rate in the window.
- Blocked (Max) — peak traffic the TMS discarded as malicious, as the maximum rate in the window.
- Clean (P95) — legitimate traffic forwarded after filtering, as the 95th percentile of clean volume in the window.
- Event Count — number of DDoS events detected in the window.
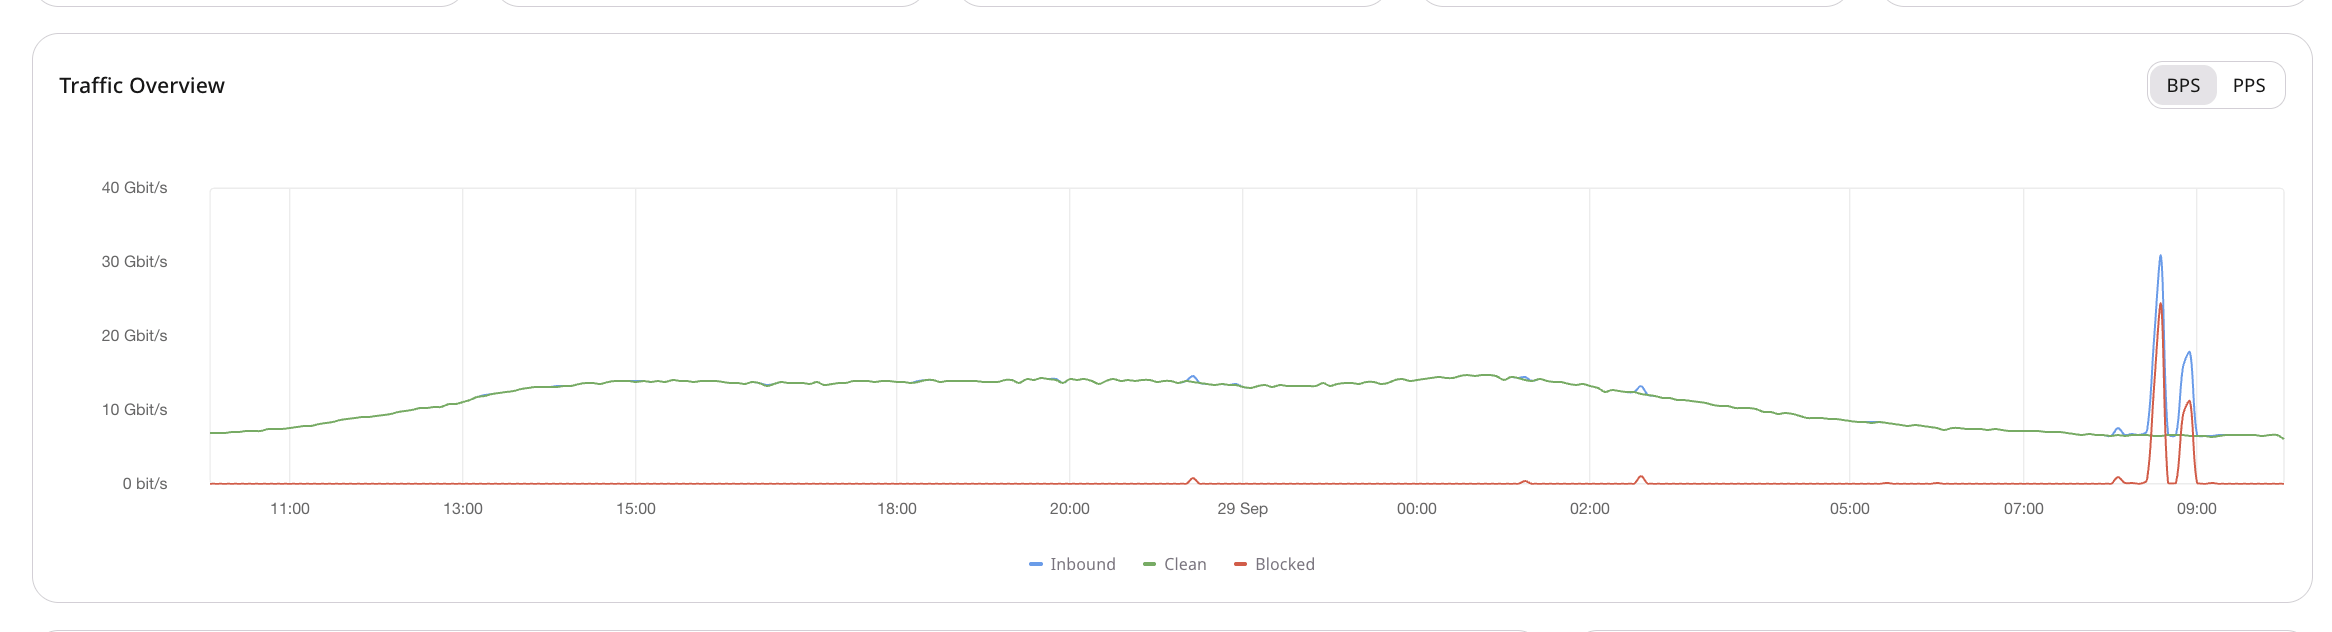
- Policy Overview — traffic in the selected window grouped by the protection policy that processed it, so it is clear which policies were active.
- Latest events — a table of recent incidents that match the current filters. Open a row to continue the investigation, or use the Events log for a three-month history and per-incident detail.
- Event Vectors — the mix of event types in the window, which helps identify the dominant flood pattern.
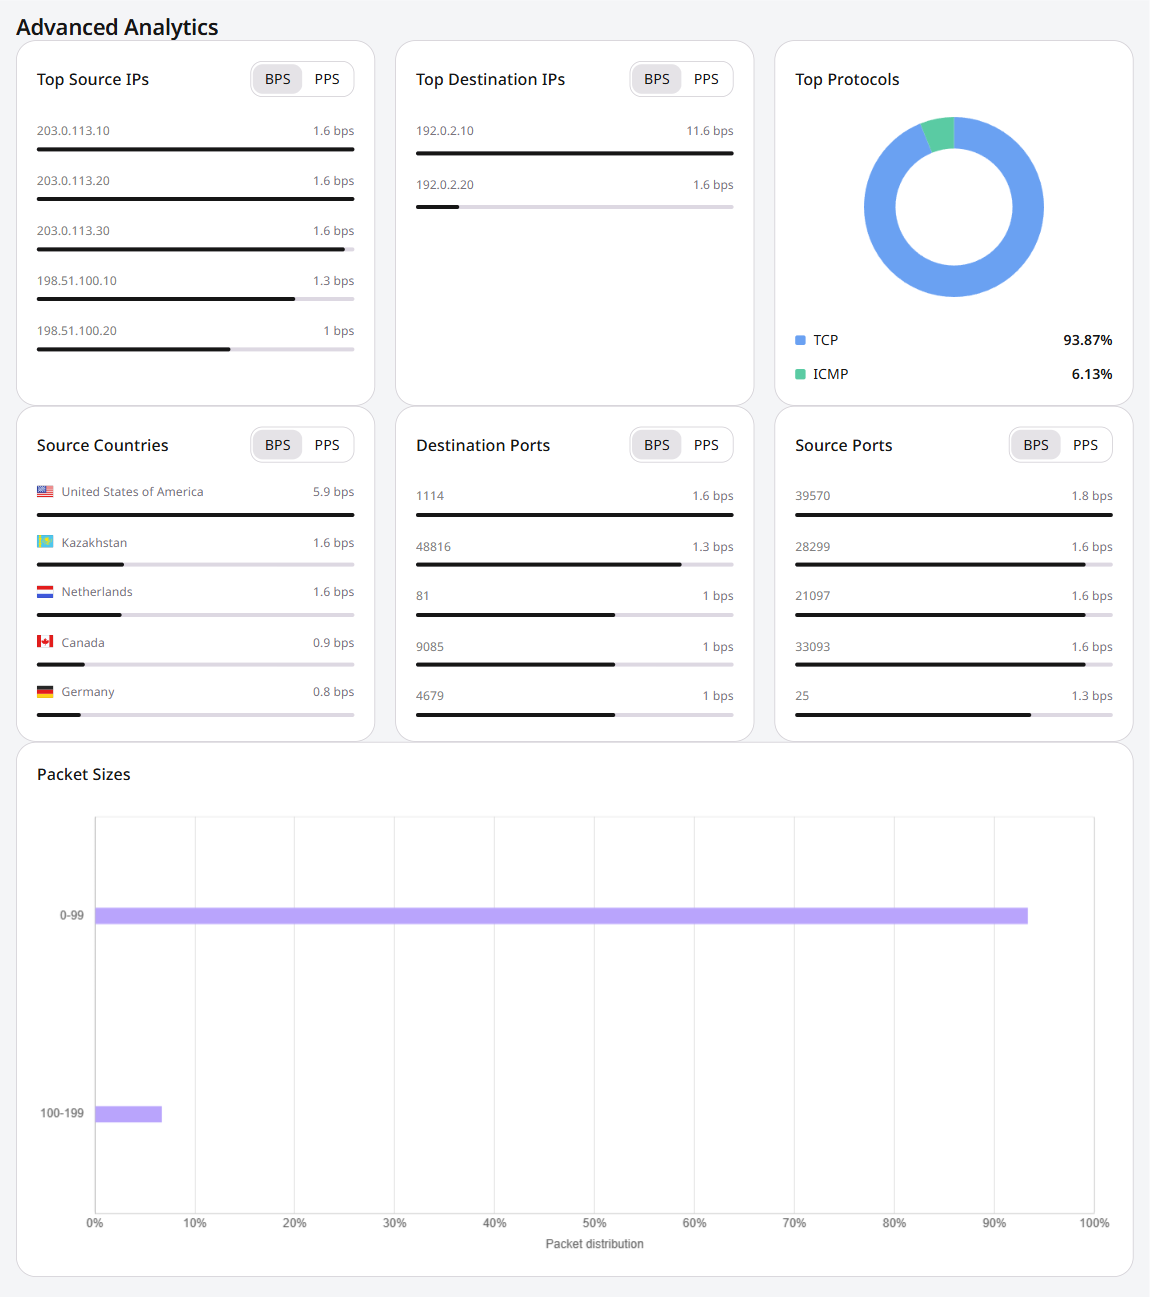
Advanced Analytics
Advanced Analytics is on the same page. It breaks the selected window down by Top Source IPs, Top Destination IPs, Top Protocols, Source Countries, Destination Ports, Source Ports, and Packet Sizes. Most of those views switch between bits per second (BPS) and packets per second (PPS). Top Protocols and Packet Sizes do not have a BPS/PPS toggle.