Step 1. Set up Managed Logging in the Gcore Customer Portal
Configure Managed Logging in the Gcore Customer Portal to obtain the OpenSearch API endpoint URL and credentials needed in later steps. For details, see Configure Managed Logging and view logs.Step 2. Install OpenSearch plugin in Grafana
If the plugin is already installed, skip to Step 3. To install the plugin: 1. In Grafana, navigate to the Administration section and click Plugins. 2. Search for the OpenSearch plugin. In the State dropdown, select All to ensure the plugin appears in the results. 3. Click Install.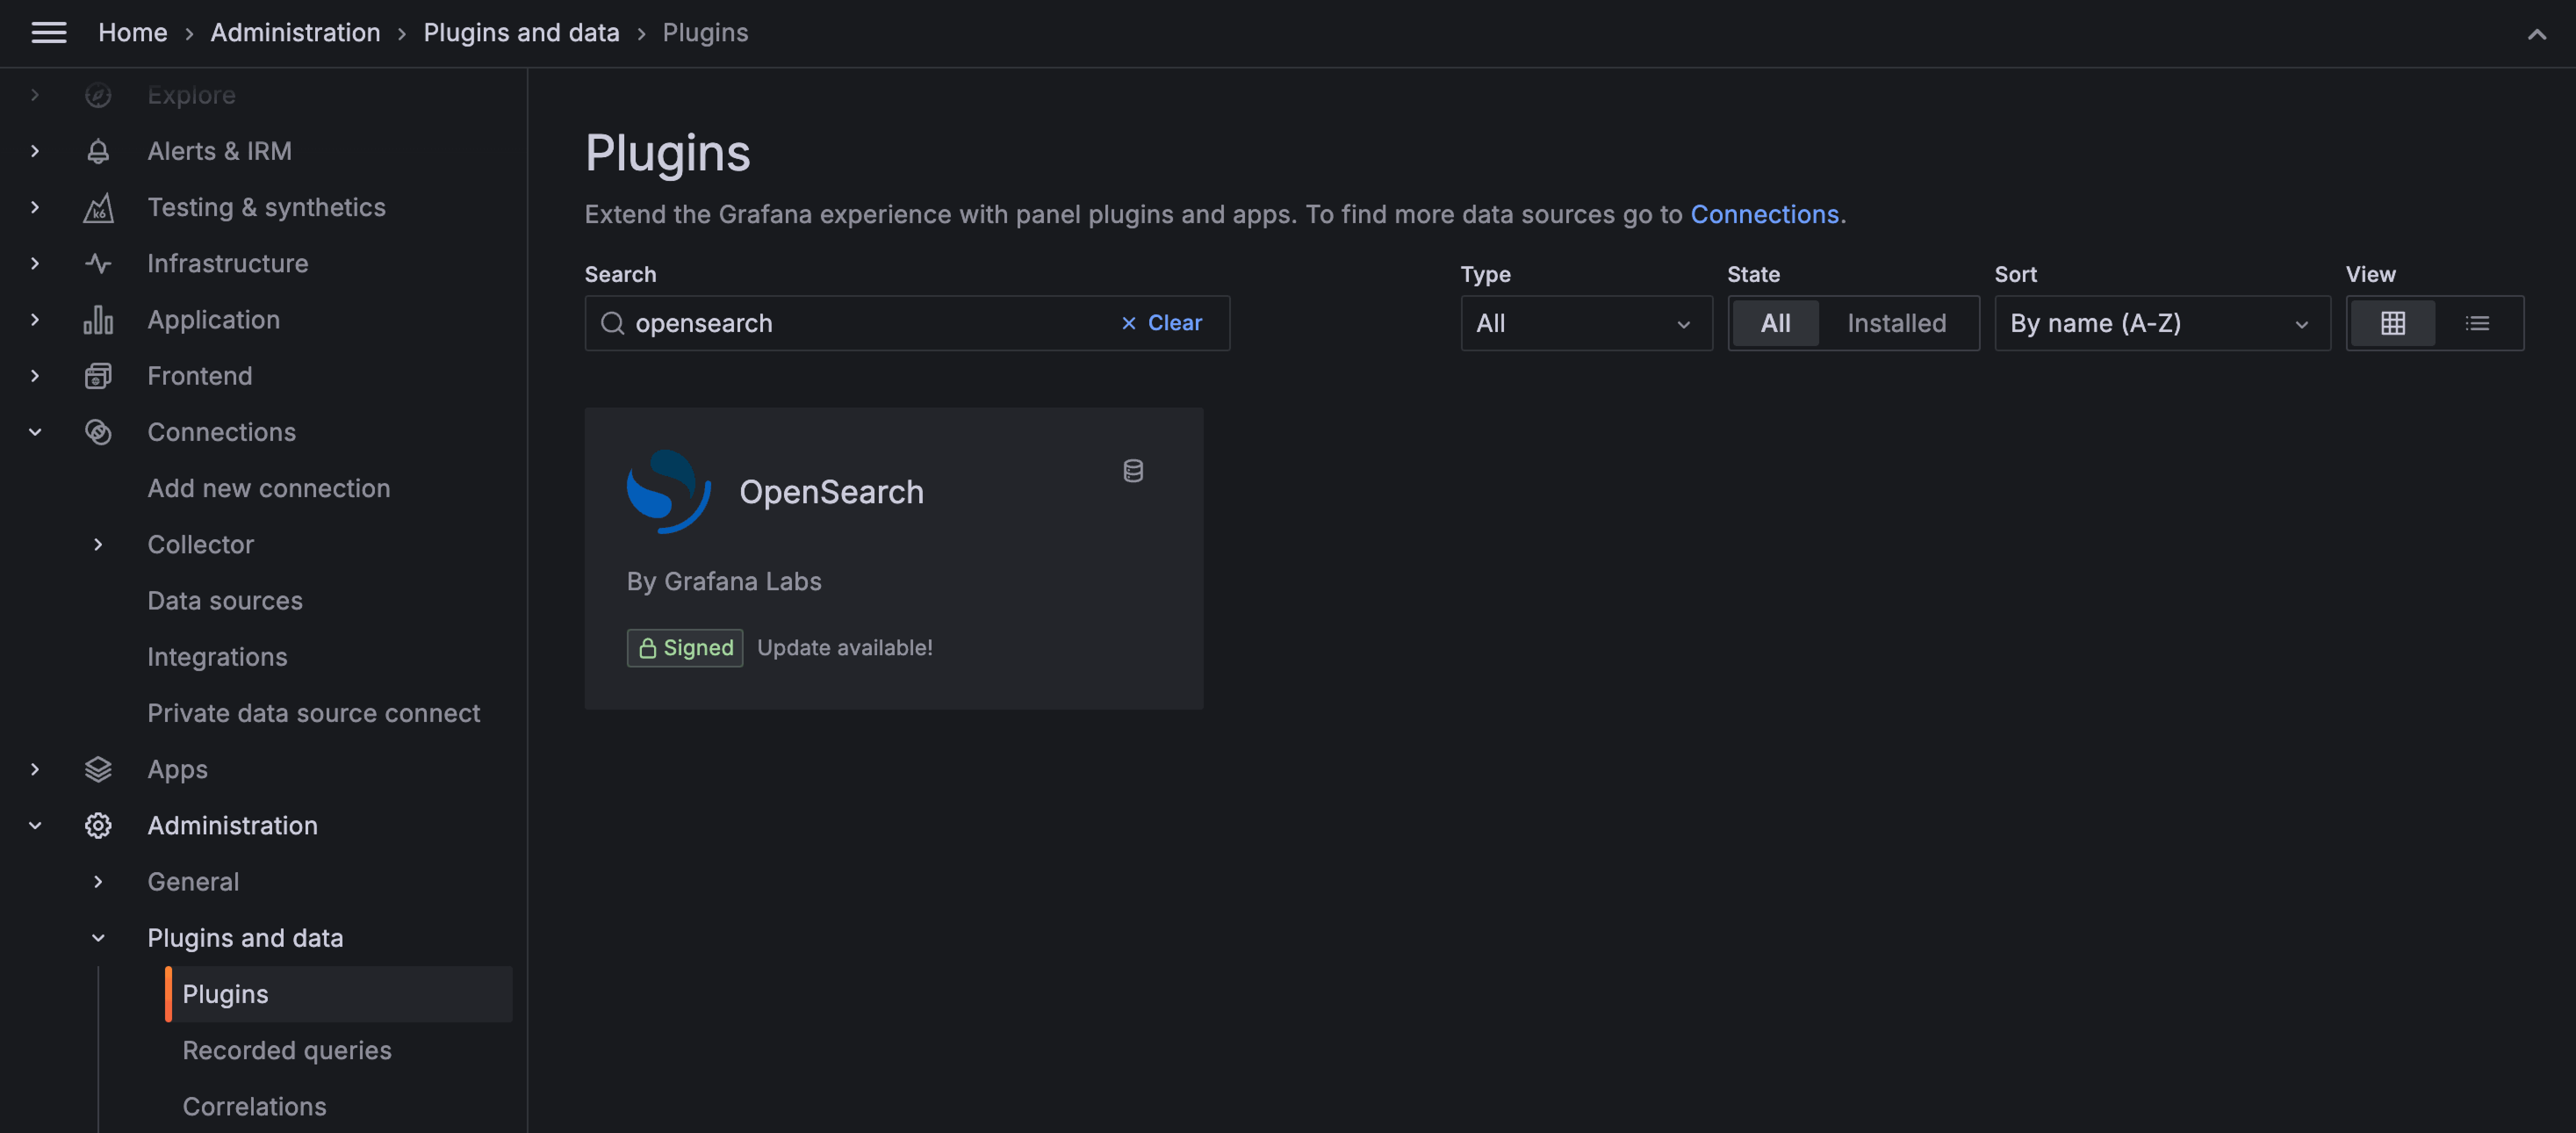
Step 3. Configure the OpenSearch plugin to display logs in Grafana
1. Open the plugin in Grafana. 2. In the top-right corner of the screen, click Add new data source.
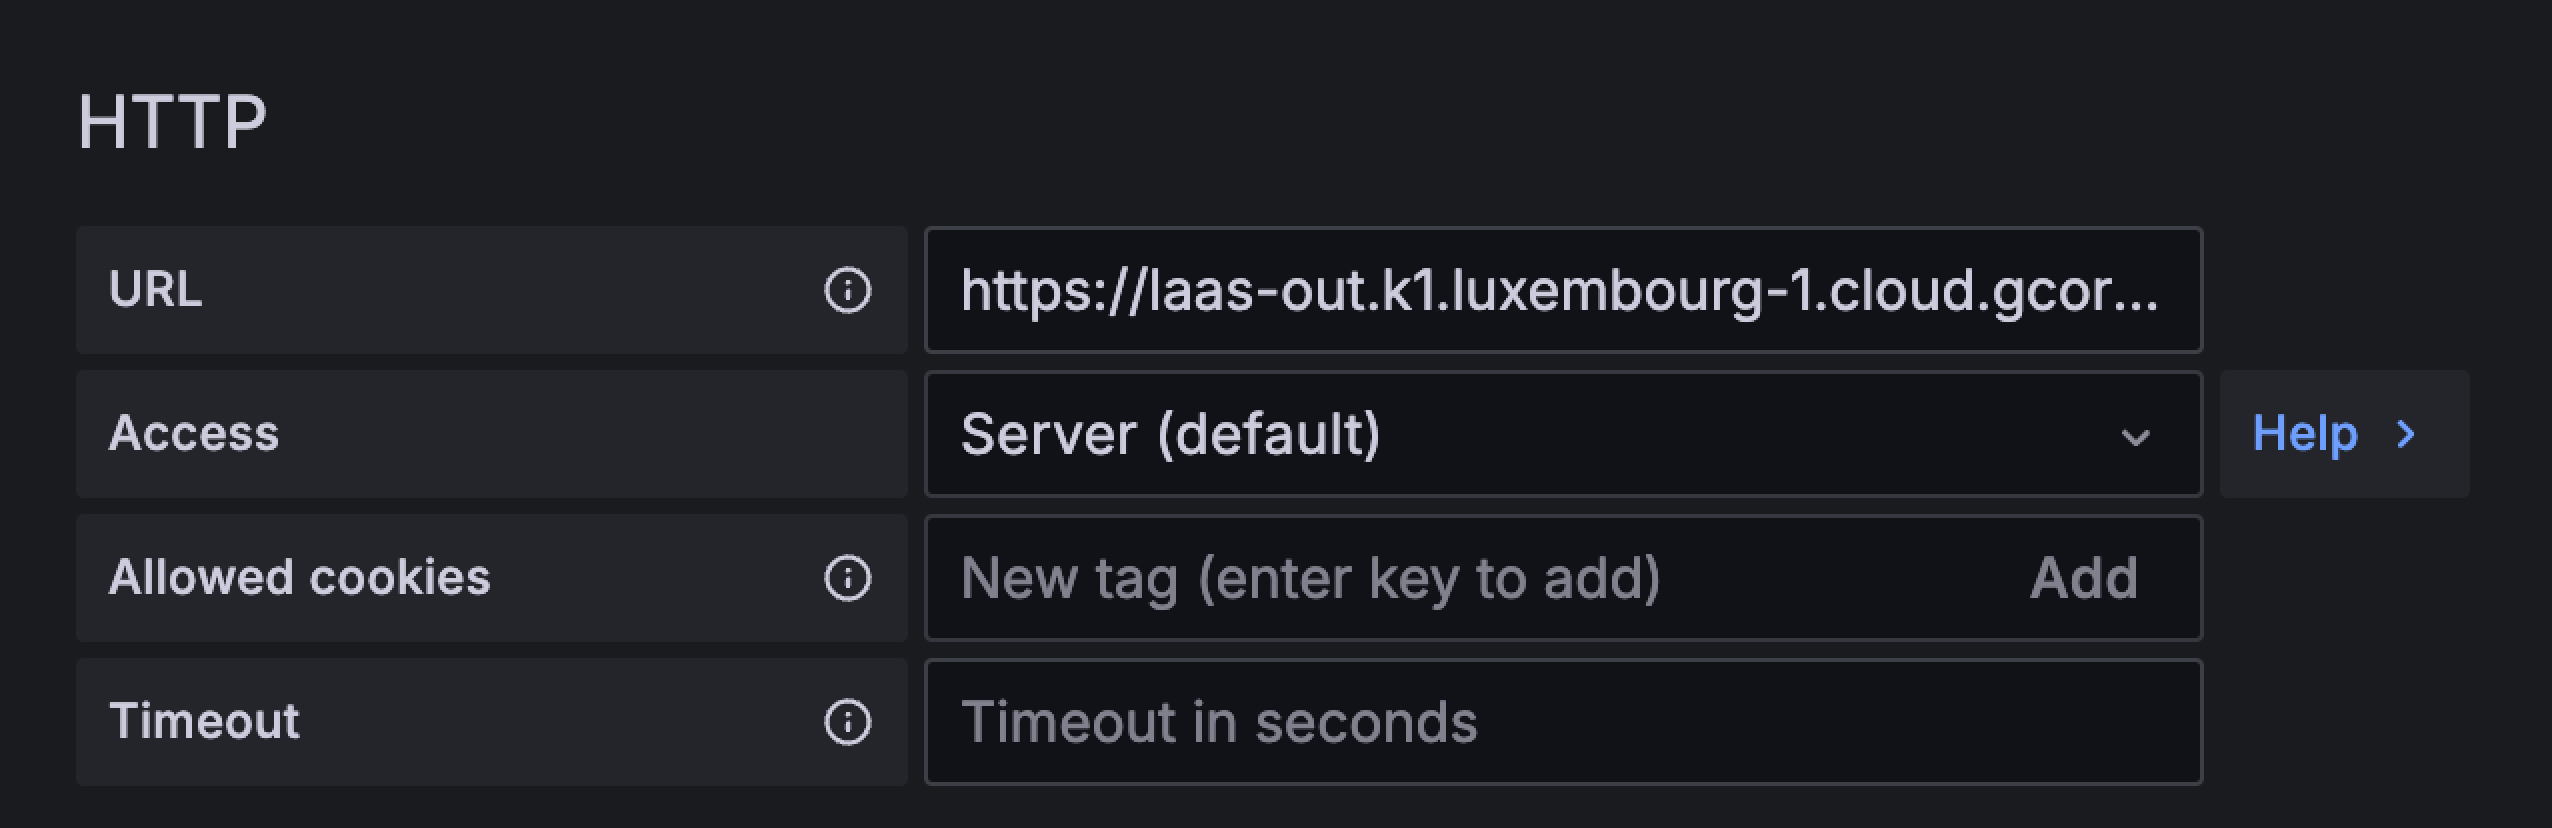
- URL: Enter the OpenSearch API endpoint URL. The URL is available in the Gcore Customer Portal on the Managed Logging page.
- Access: Server (default) makes the URL accessible from the Grafana backend. Browser makes it accessible from the browser.
- Allowed cookies: Specify which cookies are allowed in requests to the OpenSearch endpoint.
- Timeout: Set the maximum time to wait for a response from OpenSearch before Grafana terminates the connection.
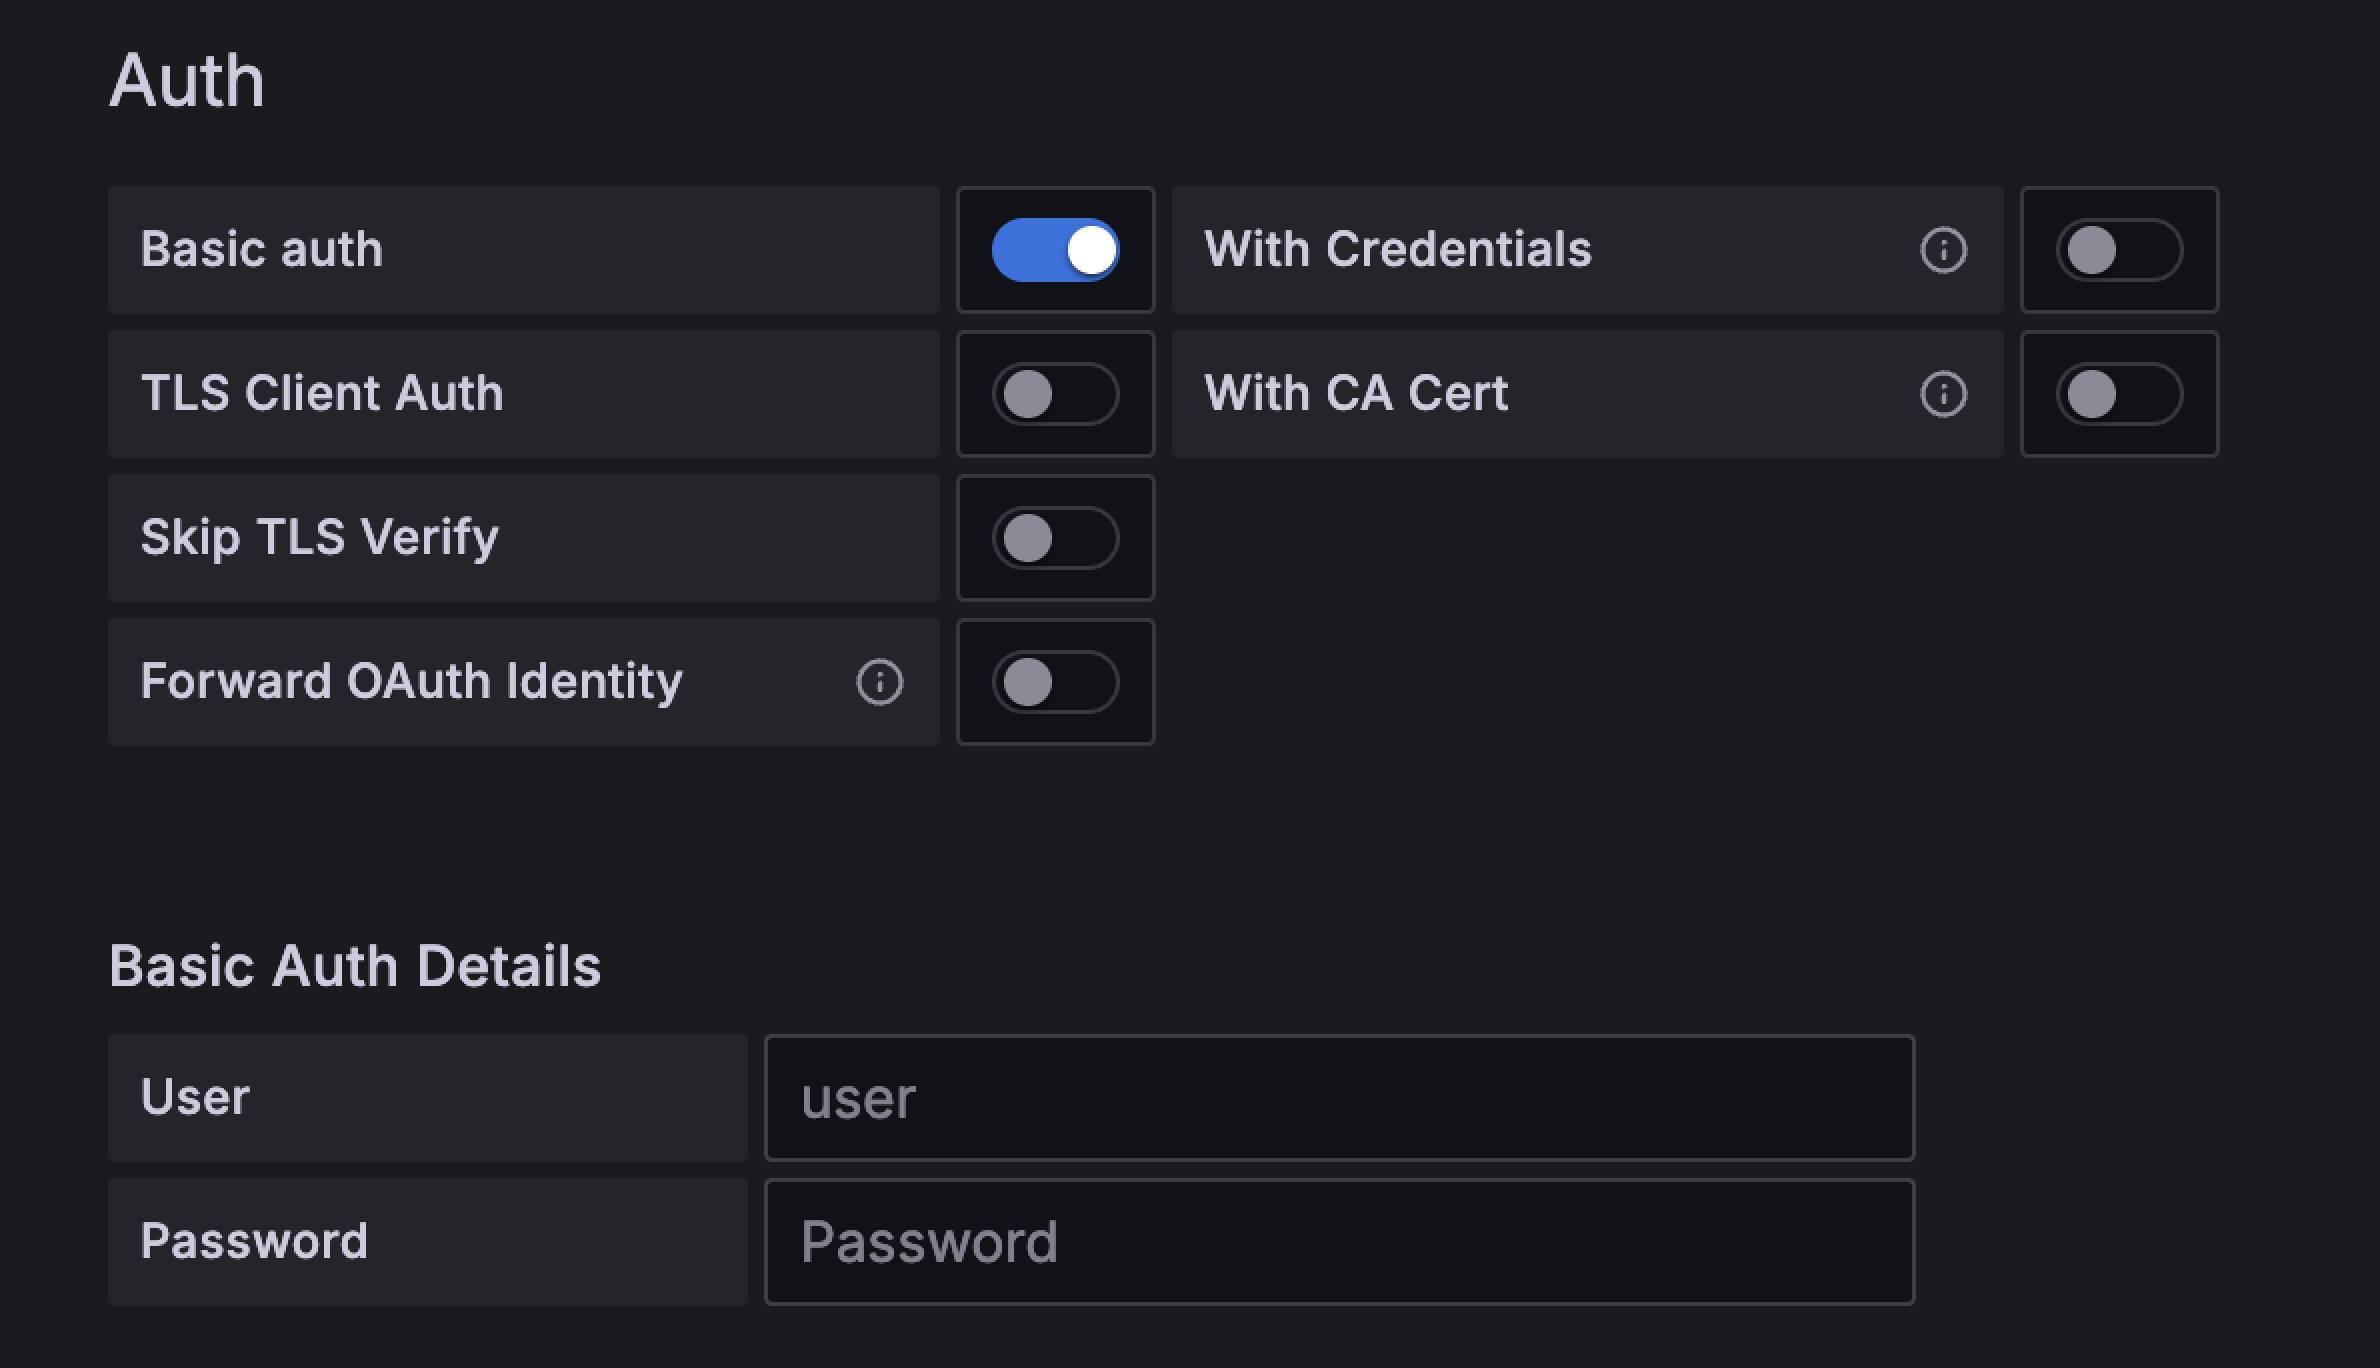
After selecting Basic auth, the following error may appear: “OpenSearch error: no permissions for [indices:admin/mappings/get] and User [name=test2, backend_roles=[], requestedTenant=null]”. This is a mapping-fetch error that does not affect data retrieval or plugin functionality — ignore it and continue.
Step 4. View logs in Grafana
To create a dashboard and display log data, follow the steps below. For more details on dashboards, see the official Grafana documentation. To display logs on a new Grafana dashboard, complete the following steps: 1. In the sidebar, click Dashboards. 2. In the top-right corner of the screen, click New > New dashboard.